


Japanese Yen, USD/JPY, US Dollar, EUR/JPY, Euro, Momentum - Talking Points
- USD/JPY is staring at new highs and momentum may see it run up
- EUR/JPY momentum could assist technical indicators for the bulls
- The Yen weakening trend might be resuming, will USD/JPY go higher?
Introduction to Technical Analysis
Learn Technical Analysis
Recommended by Daniel McCarthy
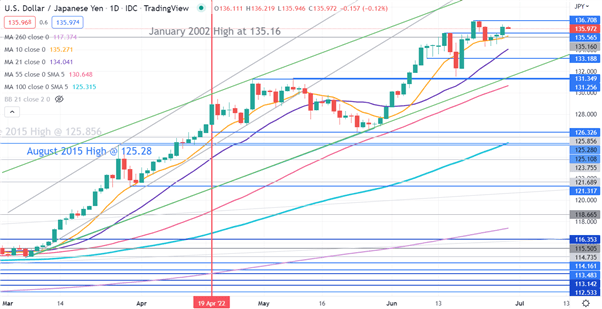
USD/JPY
USD/JPY appears to be ready to test the 24-year high seen last week as it remains in an ascending trend channel. It continues to make higher highs and higher lows.
The price has returned to be above the 10-day simple moving average (SMA) and bullish momentum may further unfold.
A bullish triple moving average (TMA) formation requires the price to be above the short term SMA, the latter to be above the medium term SMA and the medium term SMA to be above the long term SMA. All SMAs also need to have a positive gradient.
Looking at any three of the 10-, 21-, 55-, 100- and 260-day SMAs, the criteria for a TMA has been met.
A support zone might lie at 131.25 - 131.35 where there are two break points and an ascending trend line. Running parallel to the trend line is the 55-day SMA that may also provide support, currently at 130.65.
The recent peak of 136.71 might offer resistance.

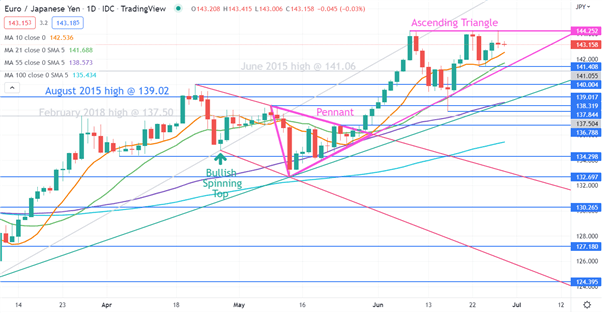
EUR/JPY
After breaking the topside of a Pennant formation at the end of May, EUR/JPY has continued to move higher.
It initially made a 7-year high at 144.25 and that level has offered resistance on a few occasions and may continue to do so.
Similar to USD/JPY, bullish momentum appears to be unfolding. Looking at any combination of the 10, 21-, 55- and 100-day SMA, the criteria for a triple moving average (TMA) formation has been met.
An Ascending Triangle is a bullish continuation pattern and is characterized by a rising lower trendline and a flat, horizontal line.
This pattern indicates that buyers are more aggressive than sellers as price continues to make higher lows. The pattern completes itself when the price breaks out of the triangle in the direction of the overall trend.
An ascending triangle can be observed in EUR/JPY and might suggest that a topside breakout could occur.
On the downside, support may lie at the recent low and ascending trend line, both currently at 141.41.
--- Written by Daniel McCarthy, Strategist for DailyFX.com
To contact Daniel, use the comments section below or @DanMcCathyFX on Twitter


