


Ichimoku Alert: Bullish Pressure On EUR/USD On H4 Chart Plus Sentiment
Chart:
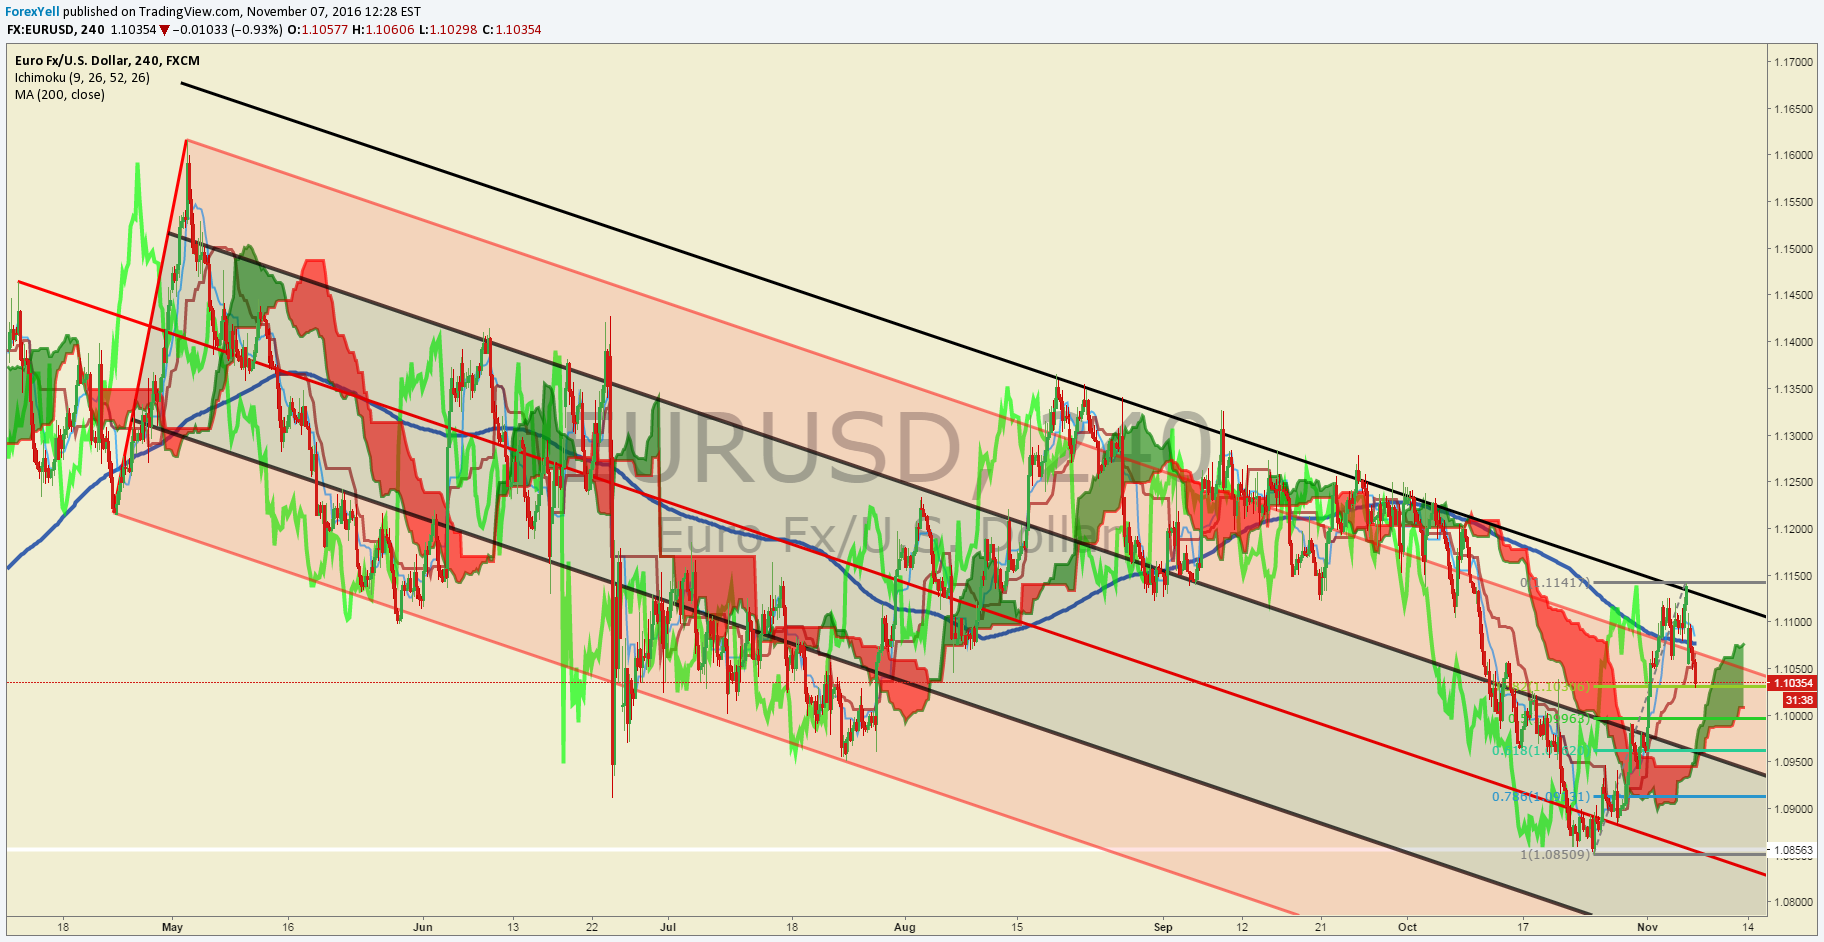
EUR/USD price moved lower aggressively on Monday, but there are signs of Bullishness on the chart and in the options market that traders should watch. First, the price of EUR/USD has begun trading toward the top of a falling channel. If the price of EUR/USD breaks above the channel and the Trendline drawn with the slope of the channel, we could have a very strong breakout higher on our hands.
Looking at Ichimoku, you can see that the price had moved aggressively above the cloud, which is seen as a trend filter, from late October when price traded at 1.0850 to as high as 1.11417 on Friday, November 4. The sharp move higher seen on the 4-hour chart as taking the price to the top of the bearish channel. Another move higher, as long as the price holds above the cloud may indicate a breakout to the upside.
Ichimoku traders who look at the 4-hour chart can look to see if the price stays above the cloud, which has turned a bullish color (green) on that chart. In addition to price, keeping an eye on the lagging line (bright green line behind price) would be indicative of Bullish pressure remains.
Lastly, the options market has shown that in early November, options traders have become their most bullish on the euro against the dollar on record. This reading is gauged by one-week risk reversal rate that measures positioning and sentiment with Bloomberg data going back to 2003.
If the price breaks below the cloud and stays below the Trendline, the bullish signal would not be triggered.
What Is Ichimoku Cloud? Read Our Definitive Guide to Trading Trends with Ichimoku Cloud


