


Indices Technical Forecast: Bullish
- S&P 500 breaking out of channel/bull-flag pattern
- Dow Jones snapped range to the top-side
- Nasdaq 100 carved out higher-low above support

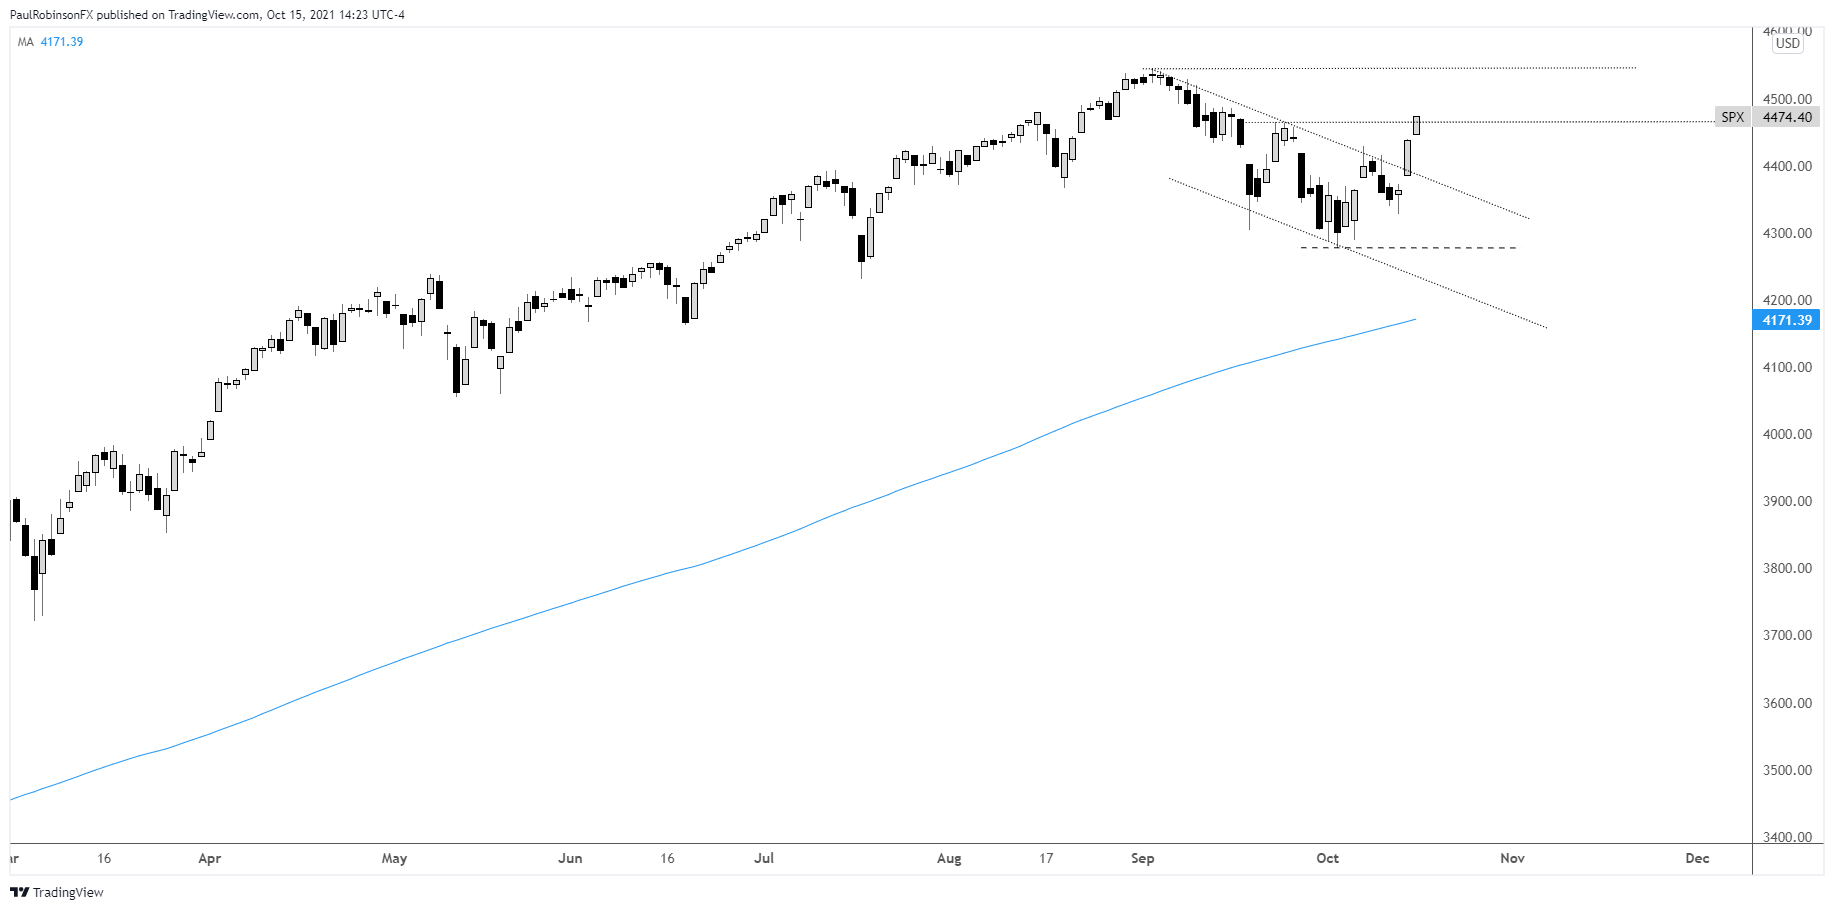
S&P 500 Technical Forecast
The S&P 500 broke out of a bullish pattern on Thursday when it crossed the top-side trend-line running down off the highs. This could send the SPX back to the record highs in short order, with 4545 needing to get crossed to notch a new all-time high.
It would take a drop back below 4329 to turn the outlook neutral to bearish, at this time looking like a lower probability scenario. For now, the trading bias in the near-term is bullish with small dips and consolidation patterns viewed as potential opportunities to enter along the path of least resistance.
S&P 500 Daily Chart
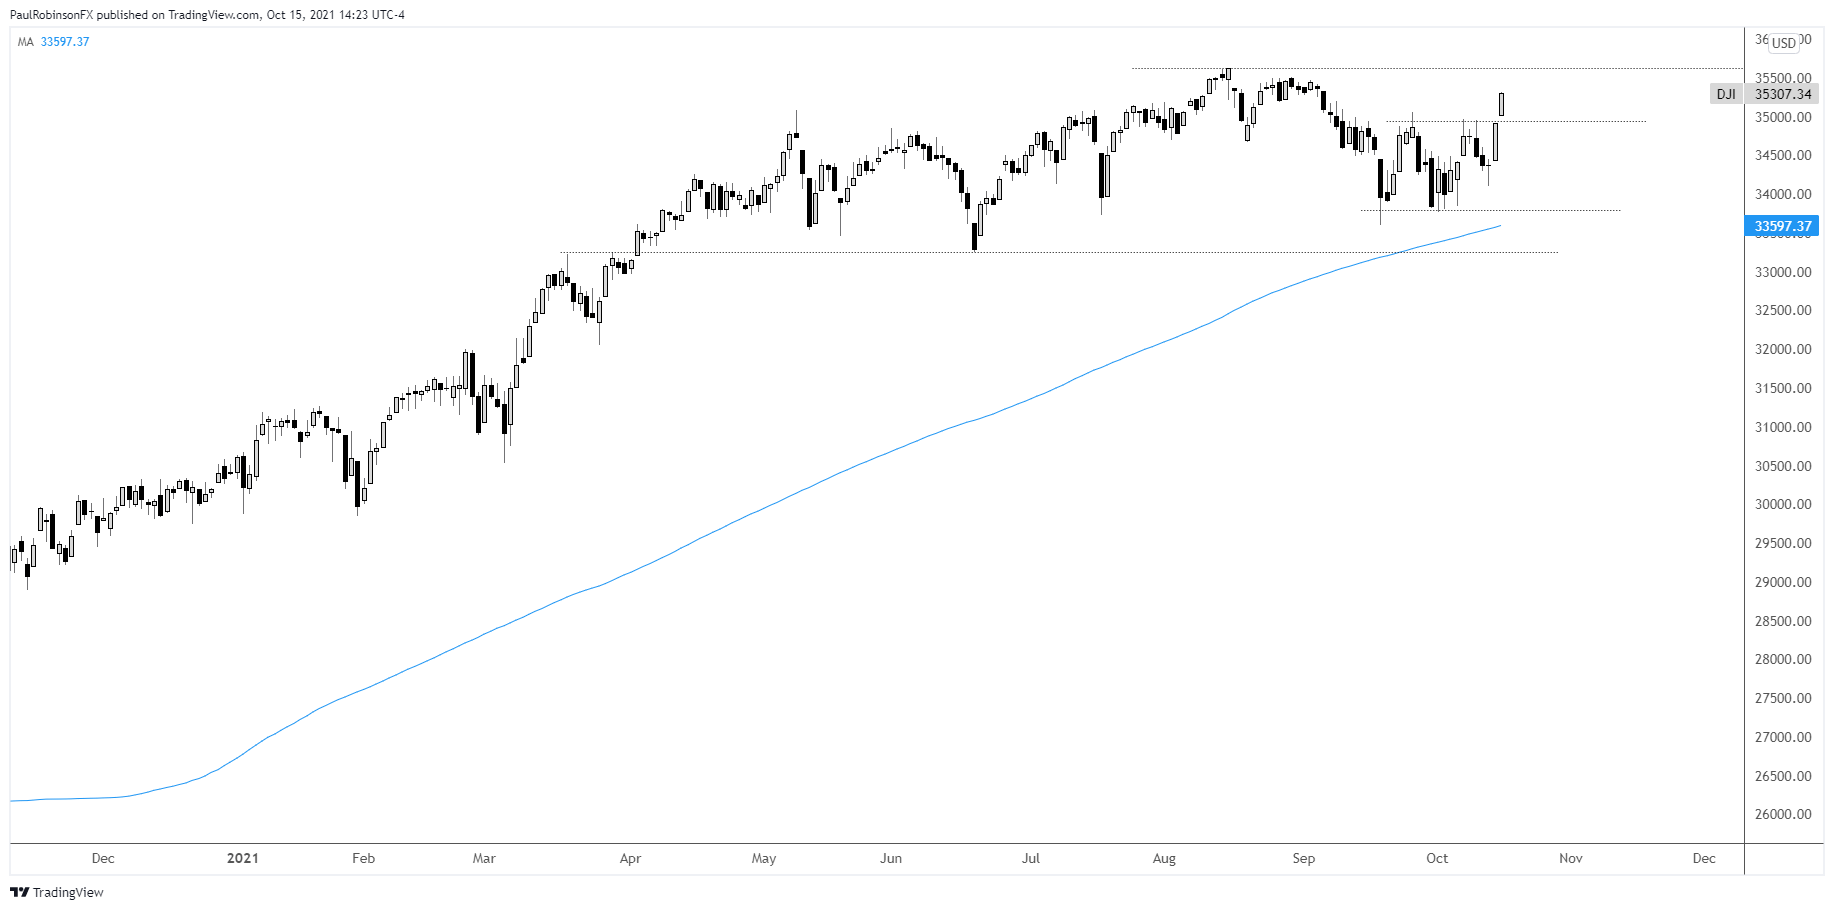
Dow Jones Technical Forecast
The Dow Jones is breaking out of a range it has been stuck in for nearly a month. The breakout has the record high at 35631 in focus. To flip the picture back downward a decline into the range is needed, with a close below 34800 to really confirm this scenario.
Dow Jones Daily Chart
Dow Jones Chart by Tradingview
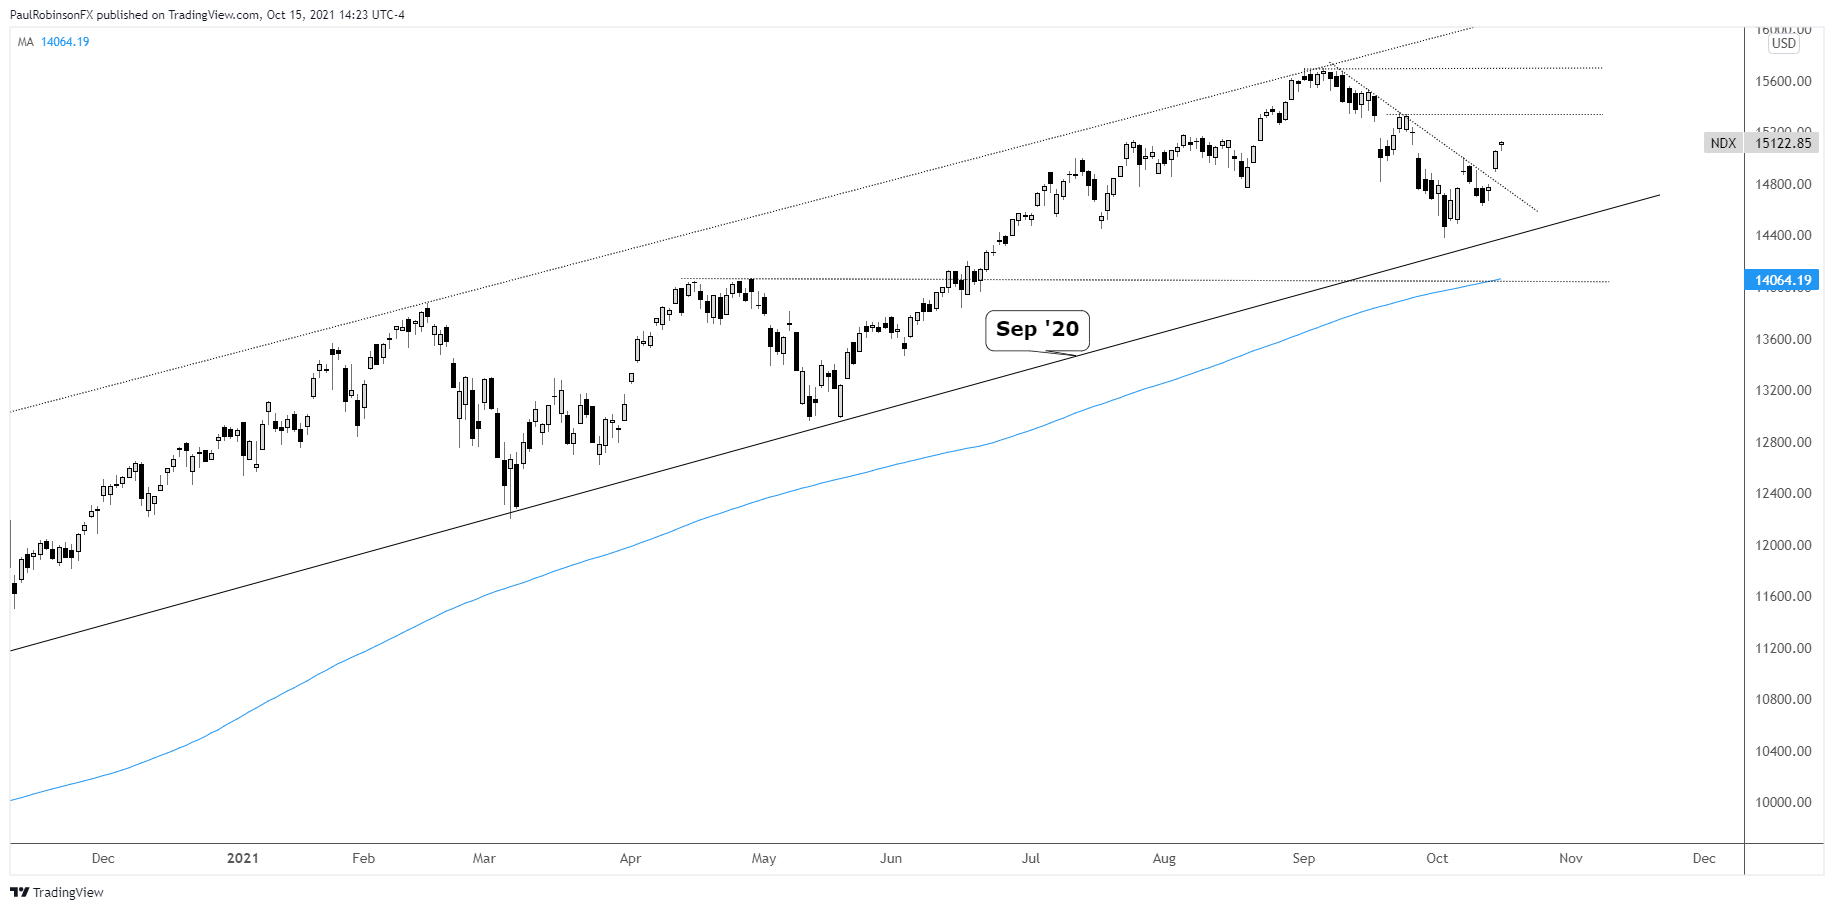
Nasdaq 100 Technical Forecast
The Nasdaq 100 has a very similar look to it as the S&P 500, with it crossing above the trend-line running off the record high. It has some work to do to get back to a new record, with 15356 as the next level to contend with.
After that the record high at 15701 will come into focus. To turn the outlook bearish in the near-term the low at 14636 would need to be broken, but it wouldn’t be long after that that the September 2020 slope would get tested and could put in a floor. A situation we will worry about later should it become relevant.
Nasdaq 100 Daily Chart
Nasdaq 100 Chart by Tradingview
Resources for Forex Traders
Whether you are a new or experienced trader, we have several resources available to help you; indicator for tracking trader sentiment, quarterly trading forecasts, analytical and educational webinars held daily, trading guides to help you improve trading performance, and one specifically for those who are new to forex.
---Written by Paul Robinson, Market Analyst
You can follow Paul on Twitter at @PaulRobinsonFX


