


Gold Technical Outlook:
- Gold may not offer good cues in the intermediate-term
- A macro wedge formation may take through Q4 to fully develop
- Big support down around the 1675 level

Last quarter’s outlook ended on this note – “For the next quarter the technical outlook doesn’t appear set to offer any real clear looks, so we might need to be patient before establishing a firmer intermediate-term trading bias.”
This may be the case again as we head down the final stretch of the year. It doesn’t mean we can get complacent towards a big move developing, because one could take hold, but it’s prudent to keep expectations aligned with the current reality.
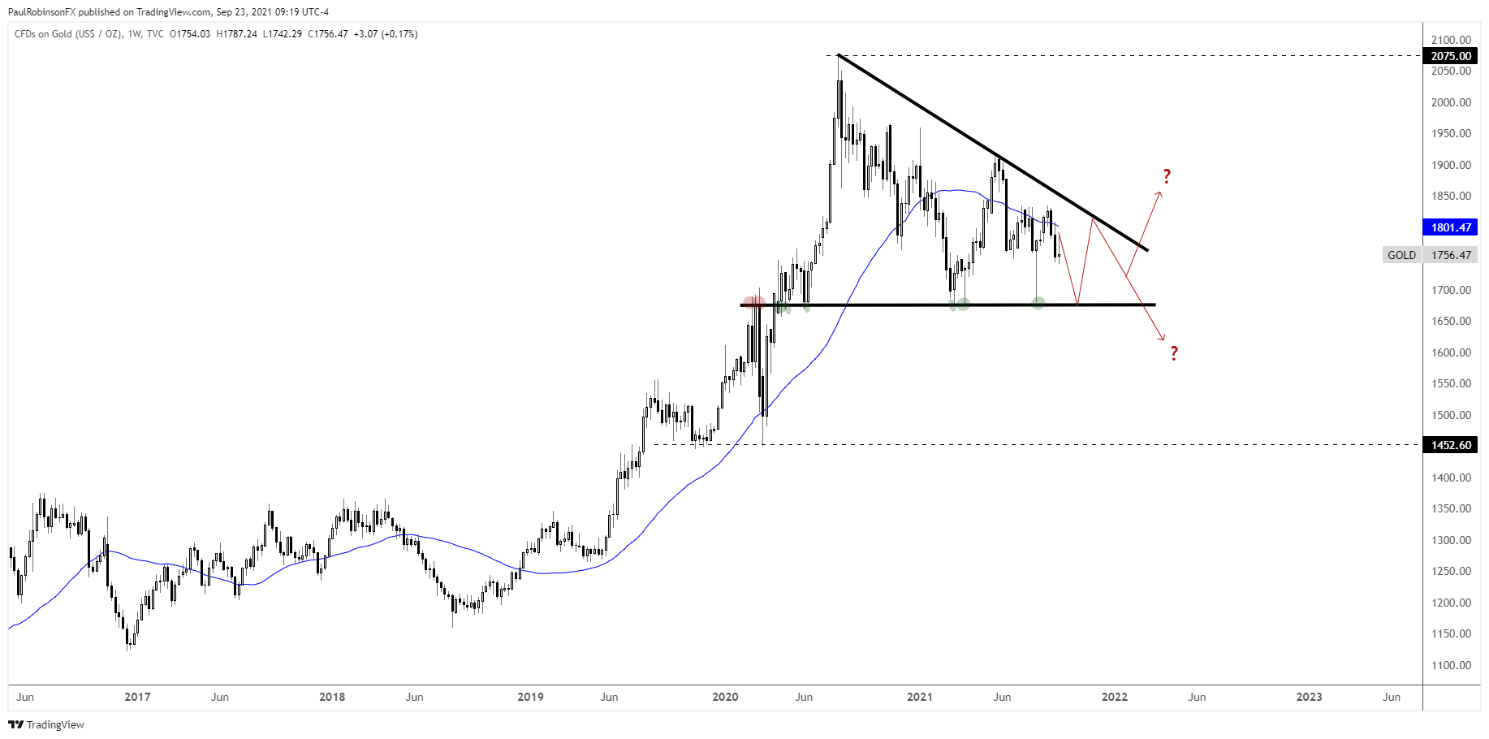
The developing descending wedge remains a longer-term focus. The pattern has been forming for well over a year now and so when it eventually breaks the move could be quite powerful. For it to mature further a test of the lower side of the formation could happen relatively soon.
The big horizontal level to watch is right around 1675; it has been in play as resistance and support on numerous occasions since the early days of the pandemic. The most recent test and hold came during the August flash-crash. Will it act as a floor again in Q4, or could it break and usher in a wave of selling?
On the top-side, the line to watch is the upper threshold of the pattern running lower from the August 2020 high over the May high. This could act as a ceiling, but if it breaks then the outlook could quickly brighten for gold.
Looking to when the wedge could finally break, the apex may not be met until sometime in early 2022. If this is the case, then an explosive pattern will have developed with the extended coiling price action and the wait between now and then may be well worth the momentum that the breakout brings.
Gold Weekly Chart
Resources for Forex Traders
Whether you are a new or experienced trader, we have several resources available to help you; indicator for tracking trader sentiment, quarterly trading forecasts, analytical and educational webinars held daily, trading guides to help you improve trading performance, and one specifically for those who are new to forex.
---Written by Paul Robinson, Market Analyst
You can follow Paul on Twitter at @PaulRobinsonFX


