


Japanese Yen Technical Forecast
- USD/JPY trendline support looks to pause recent longer-term weakness
- GBP/JPY price action last week may give way to exhaustion this week
- GBP/JPY’s symmetrical triangle pattern in play as price near upper bound
USD/JPY Technical Forecast: Neutral
The Japanese Yen has traded in a sideways direction against the US Dollar over the past week and that same trend may continue in the near-term. Since April, USD/JPY price action has trended lower within a descending channel. Recent safe-haven outflows will likely leave traders on the sidelines before a clear technical sight forms.
USD/JPY now aims at confirming trendline support off the March lows after last month's trading saw a decisive one-day rally from the channel low. Should that eyed support fail, the early November multi-month low will likely serve as the next support zone. In any case, the broader descending channel remains in play, but those support levels may see USD/JPY tread further sideways, for now.
USD/JPY Daily Price Chart
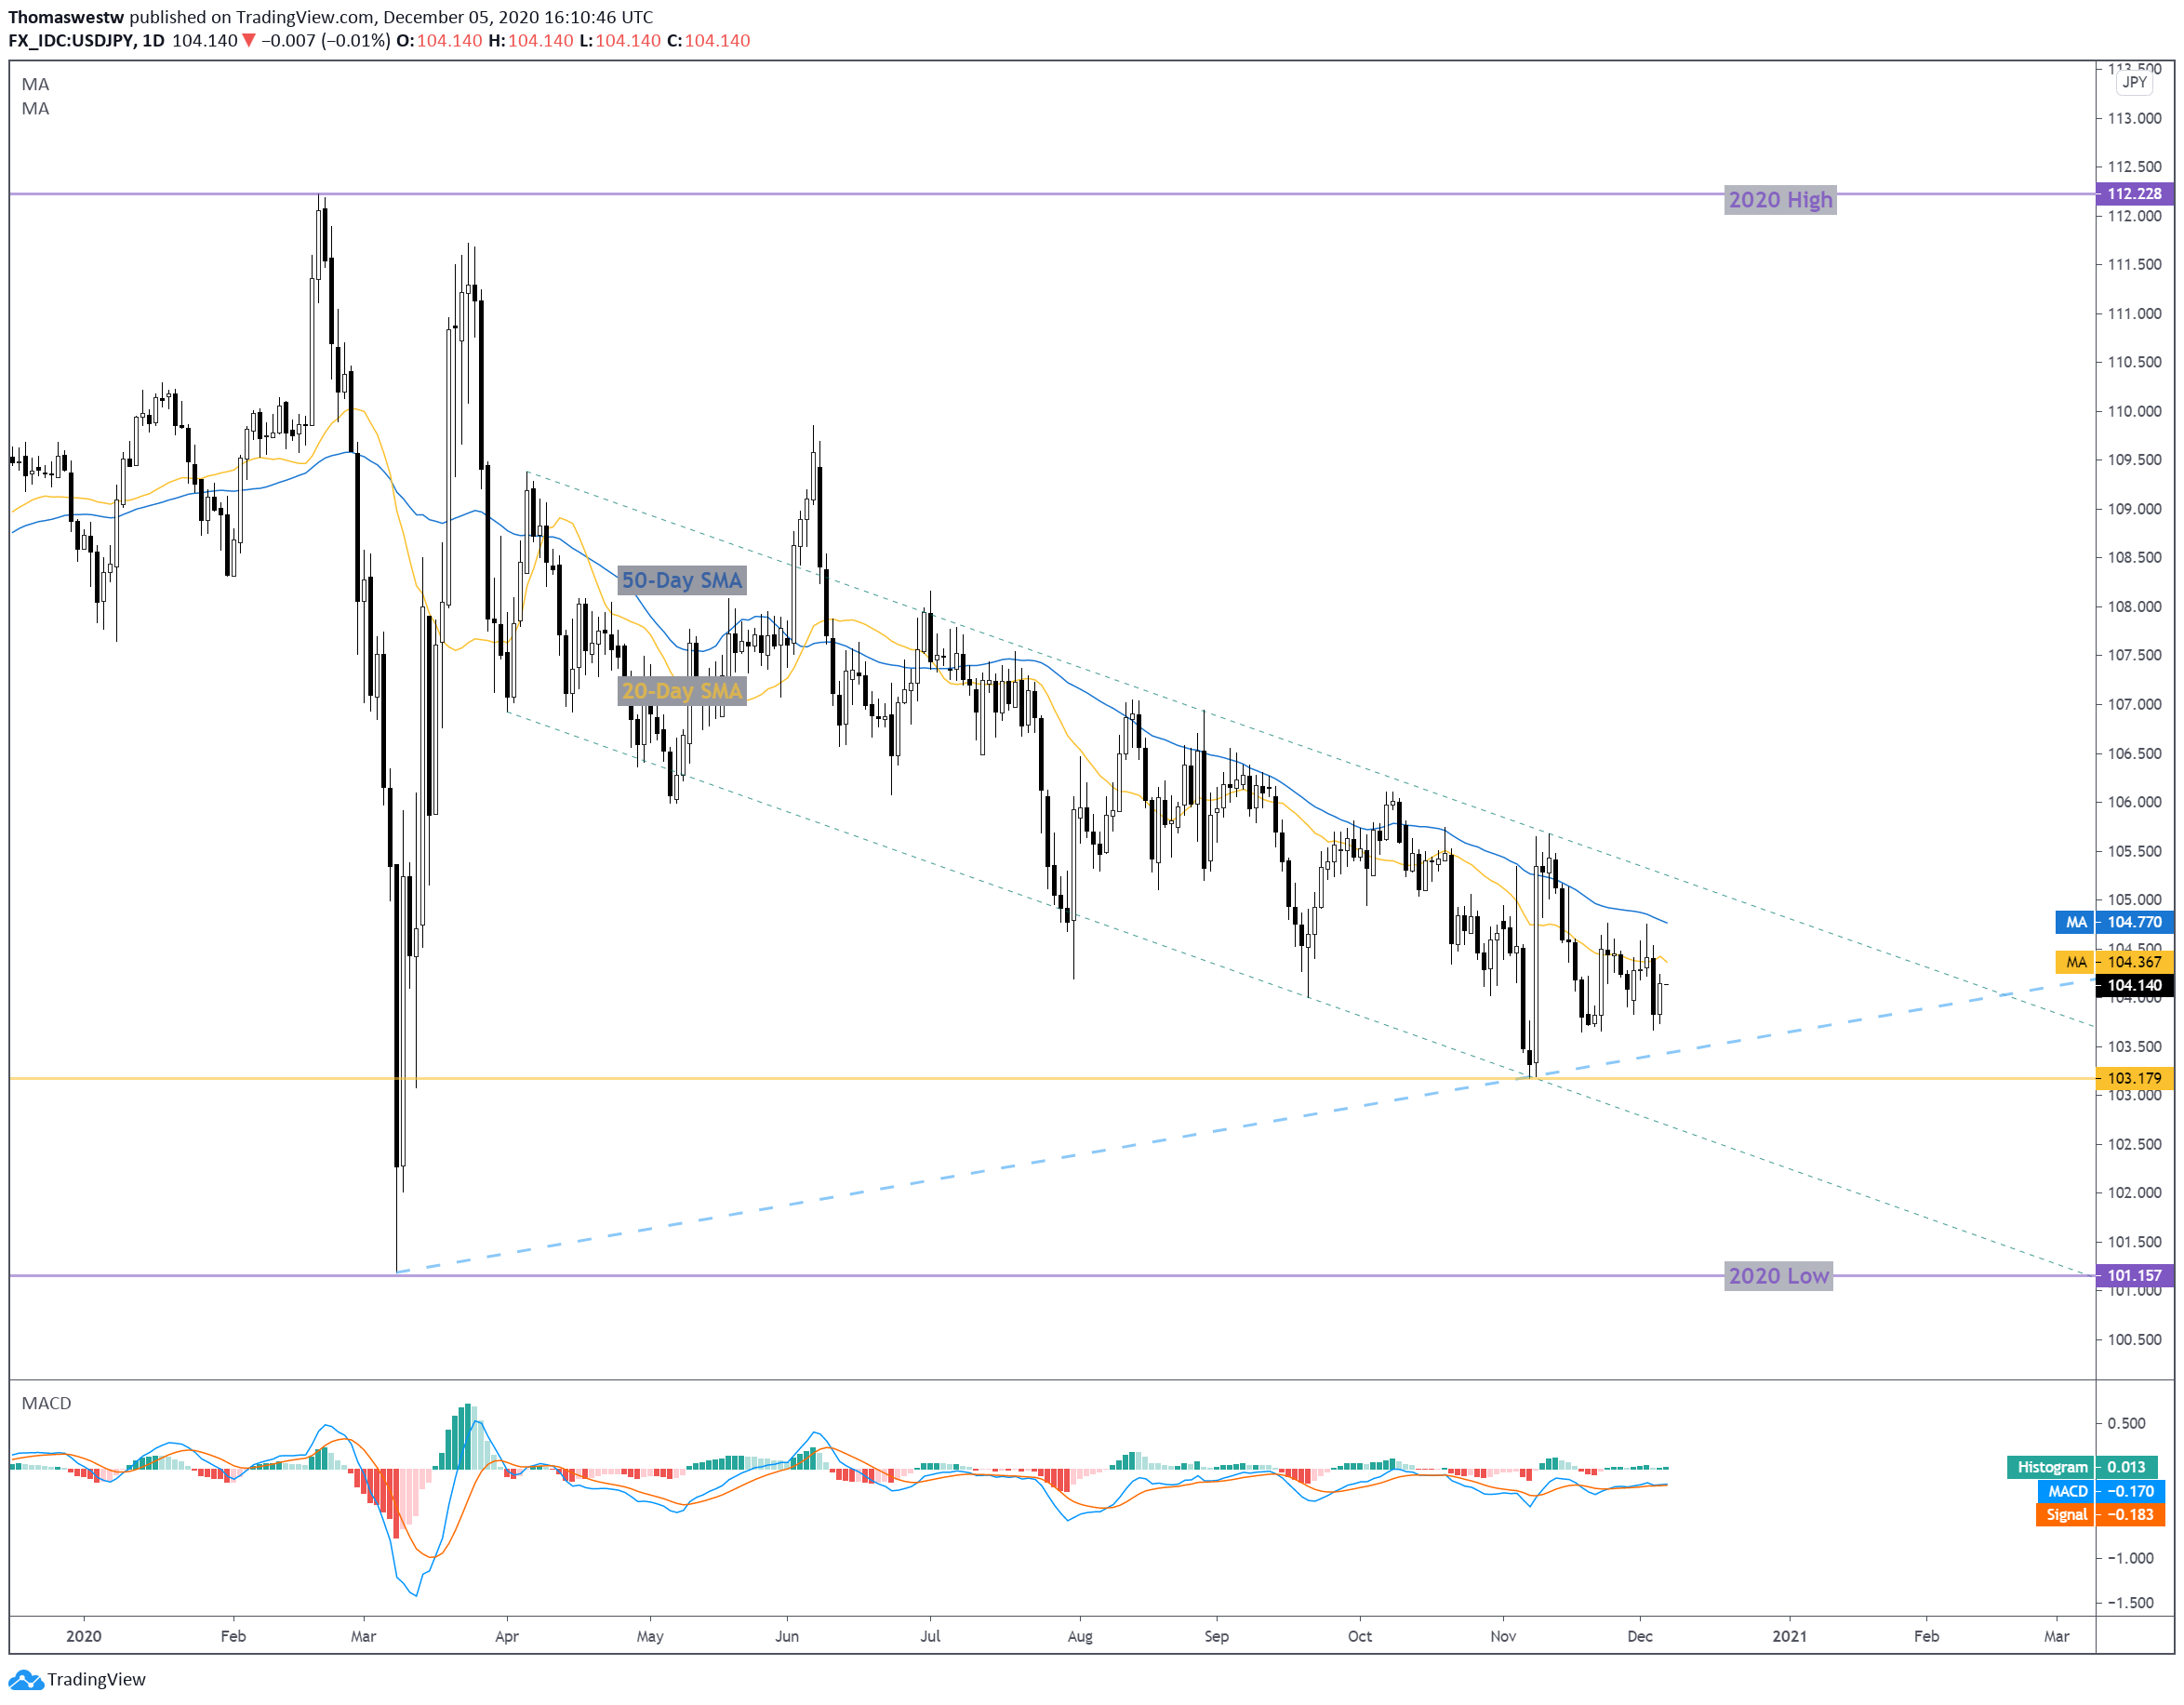
Chart created with TradingView

GBP/JPY Technical Forecast: Bearish
The Japanese Yen may see short-term strength versus the British Pound as GBP/JPY struggles to extend recent momentum. Trendline resistance from the upper bound of a symmetrical triangle rejected price action last week. The current move higher may see a near-term pullback given current conditions. While the longer-term trend continues to favor the upside, last week's price movement appeared to end in exhaustion.
To the downside, the rising 100-, 50-, and 20-day Simple Moving Averages (SMA) may offer a level of support. Nevertheless, a break towards the symmetrical triangle’s lower bound would not be surprising. The longer-term trend from the 2020 swing low would make a clean break under the triangle a difficult task for GBP/JPY bears. Hence, a move lower is in the cards, but several levels of support could stifle any follow-through.
GBP/JPY Daily Price Chart
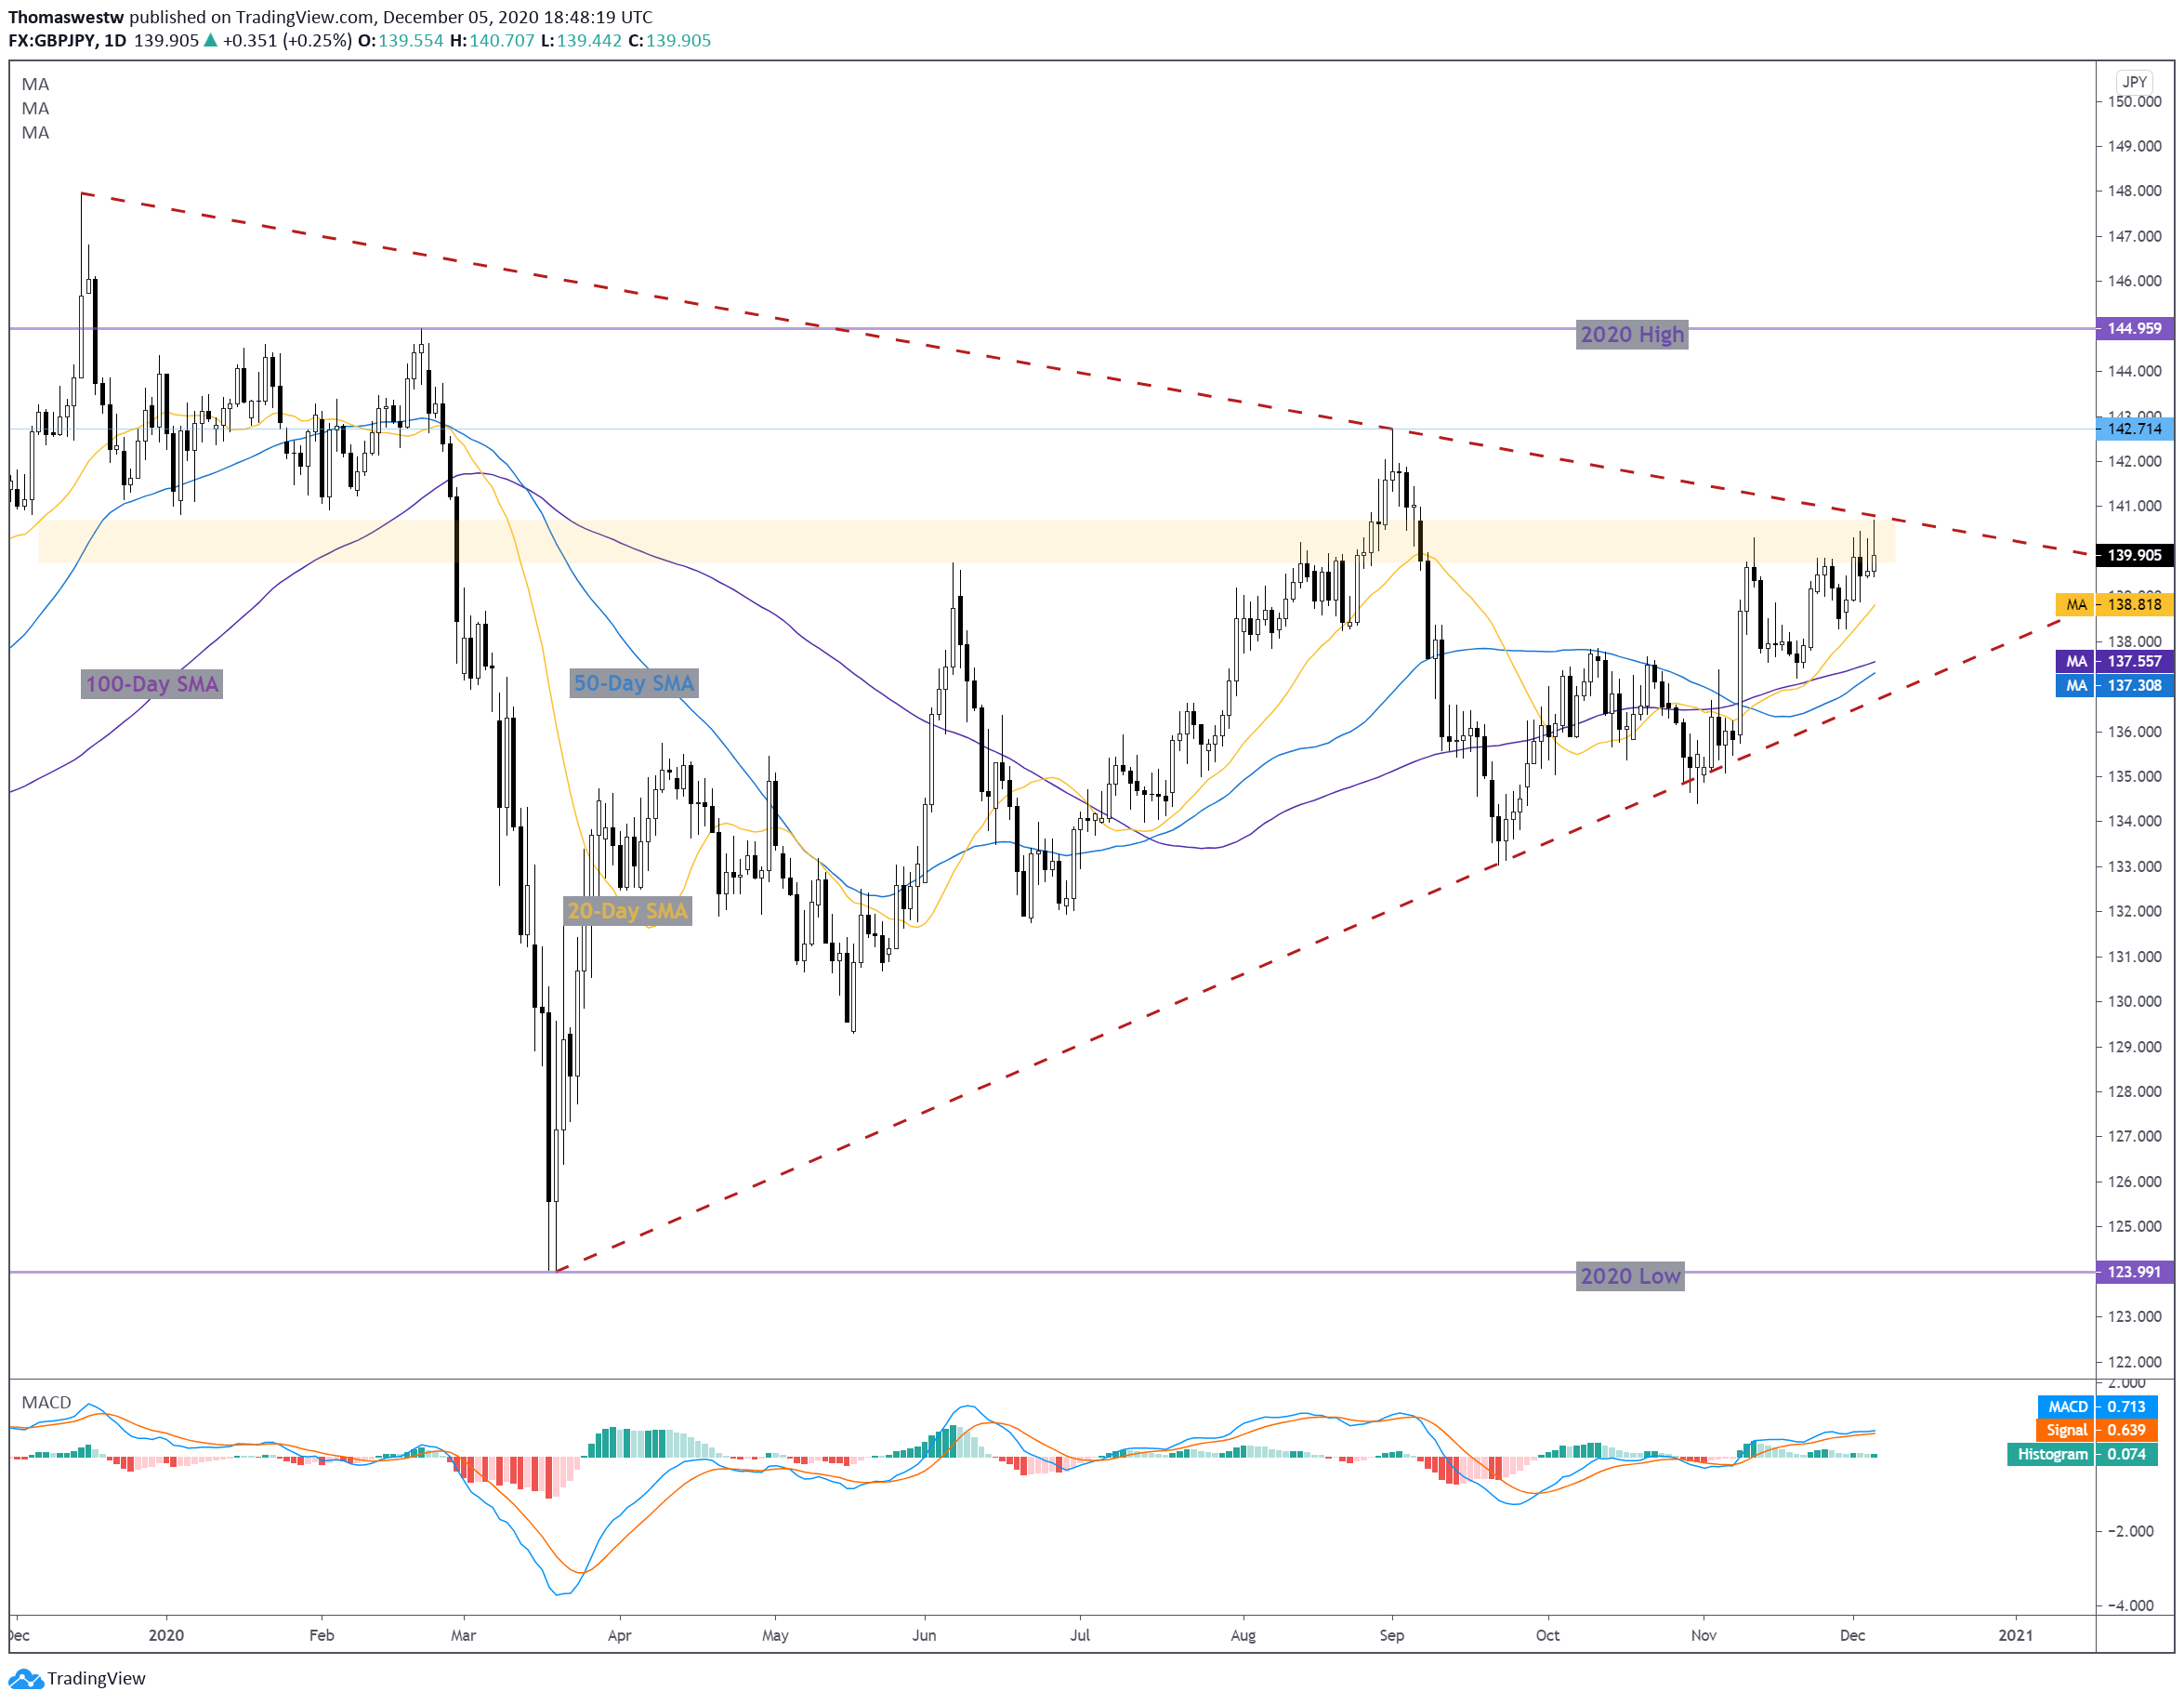
Chart created with TradingView
USD/JPY, GBP/JPY TRADING RESOURCES
- Just getting started? See our beginners’ guide for FX traders
- What is your trading personality? Take our quiz to find out
- Join a free webinar and have your trading questions answered
--- Written by Thomas Westwater, Analyst for DailyFX.com
To contact Thomas, use the comments section below or @FxWestwater on Twitter


