


SPOT USDCAD COULD CLIMB IF TECHNICAL SUPPORT HOLDS
- Spot USDCAD’s grind lower could come to a halt if key technical support holds around the 1.3000 handle
- USDCAD pressure could accelerate if the major area of confluence fails to keep spot prices afloat
- Sharpen your knowledge as a trader with these Top Trading Lessons
Spot USDCAD has edged lower over the last several weeks after printing its recent top of 1.3517 on May 31. Since then, the currency pair has swooned nearly 3.5% lower as upbeat Canadian Dollar prospects encompassing better-than-forecast economic data and a firm BOC coupling with US Dollar weakness driven by increasingly dovish Fed expectations contributed to the downward push.
From a technical perspective, spot USDCAD is now treading water slightly above support at the 1.3000 handle – a major level of confluence dating back decades. This area of support will need to be taken out before bearish momentum can continue.
SPOT USDCAD PRICE CHART: WEEKLY TIME FRAME (JUNE 05, 2016 TO JULY 19, 2019)
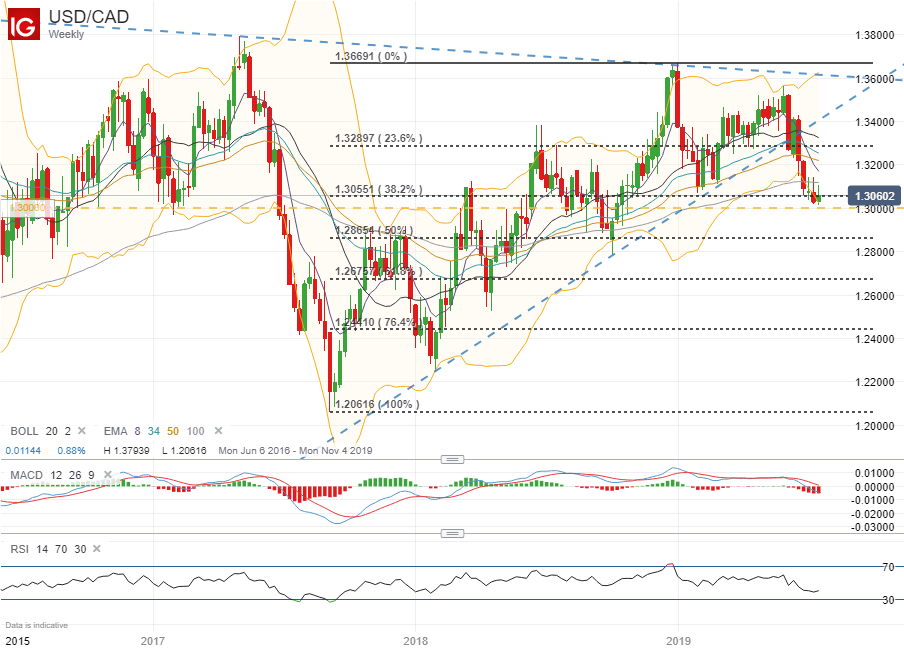
Spot USDCAD selling pressure accelerated subsequent to the break of 2018’s bullish uptrend. Although, the currency pair threatens to stay afloat with technical support provided by the psychologically-significant 1.3000 price level – which happens to align with the 38.2% Fibonacci retracement of January 2019’s high and September 2017’s low. While premature, a potential inverse head-and-shoulder pattern could be forming. A sharp rebound higher off the current level of technical support would likely serve constructive to this thesis.
SPOT USDCAD PRICE CHART: DAILY TIME FRAME (MAY 27, 2019 TO JULY 19, 2019)
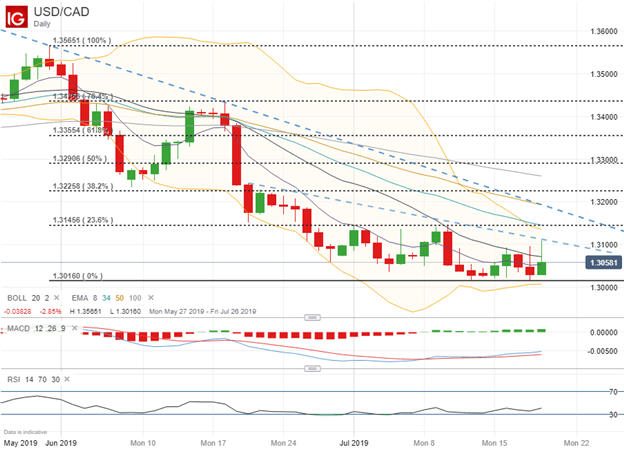
Looking to a closer time frame, the short-term downtrend formed by the series of lower highs since mid-June, in addition to technical resistance posed by the 1.31 handle, both look to serve as near-side obstacles for USDCAD bulls to overcome. If this level can be topped, however, the door to 1.3200 could open up quickly where stops on short positions threaten to exacerbate upward price action.
USDCAD CLIENT SENTIMENT PRICE CHART: DAILY TIME FRAME (JANUARY 21, 2019 TO JULY 19, 2019)
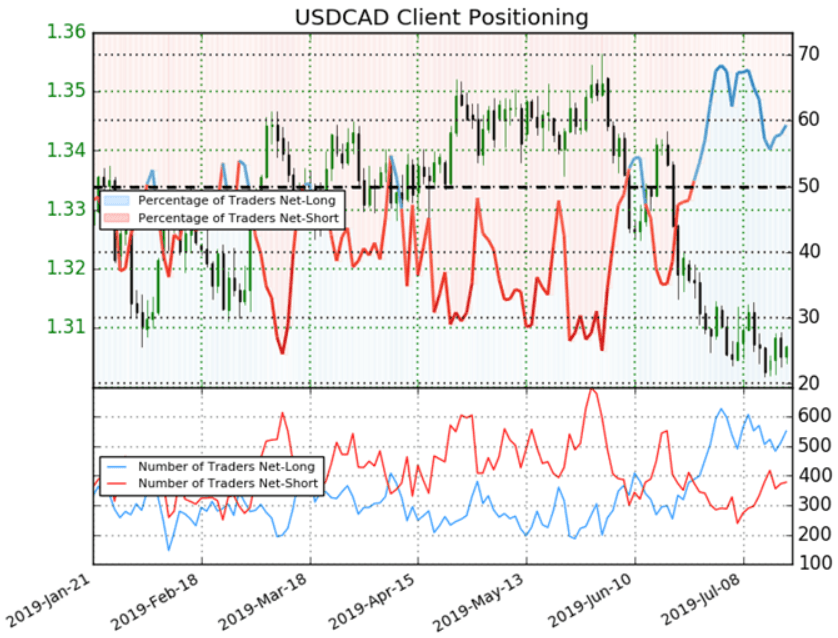
As for spot USDCAD retail trader positioning, IG Client Sentiment data reveals that 59.3% of traders are net-long resulting in a long-to-short ratio of 1.46. Although, relative to last week, the number of traders net-long is now 4.8% lower whereas the number of traders net-short is now 10.2% higher. Register for free live webinars with DailyFX analysts to learn more about client positioning data and how to incorporate it into your trading strategy.
-- Written by Rich Dvorak, Junior Analyst for DailyFX.com
Connect with @RichDvorakFX on Twitter for real-time market insight


