


Crude oil price, news and analysis:
- The price of US crude oil is strengthening again after news that two Saudi oil tankers have been attacked just outside the strategically-important Strait of Hormuz.
- From a technical perspective, the price has now broken to the upside from a triangle pattern on the chart and looks to be heading back towards the $65/barrel mark.
Crude oil technicals positive
News that two Saudi oil tankers have been attacked off the coast of the United Arab Emirates has raised fears about oil security in the Gulf region and given crude oil prices a boost.
The US contract, which from a technical perspective has been trading in a triangle pattern on the charts since Monday last week, has now jumped above the triangle’s resistance line and is drawing closer to the $63.00 high reached on May 6.
If that is breached, there is little further resistance before the $64.77 high touched on April 30.
Crude Oil Price Chart, Hourly Timeframe (April 29 – May 13, 2019)
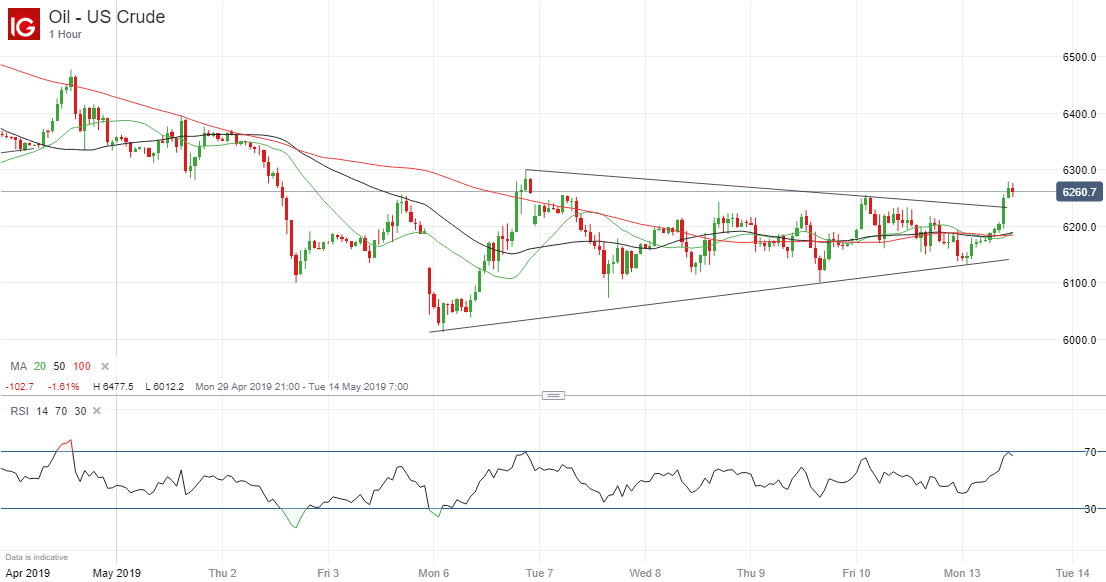
Chart by IG (You can click on it for a larger image)
Eight Surprising crude oil facts every trader should know
Meanwhile, there is plenty of support in the $61.83 to $61.87 area, where the 20-hour, 50-hour and 100-hour moving averages are clustered, as well as at $61.40, where the triangle support line lies.
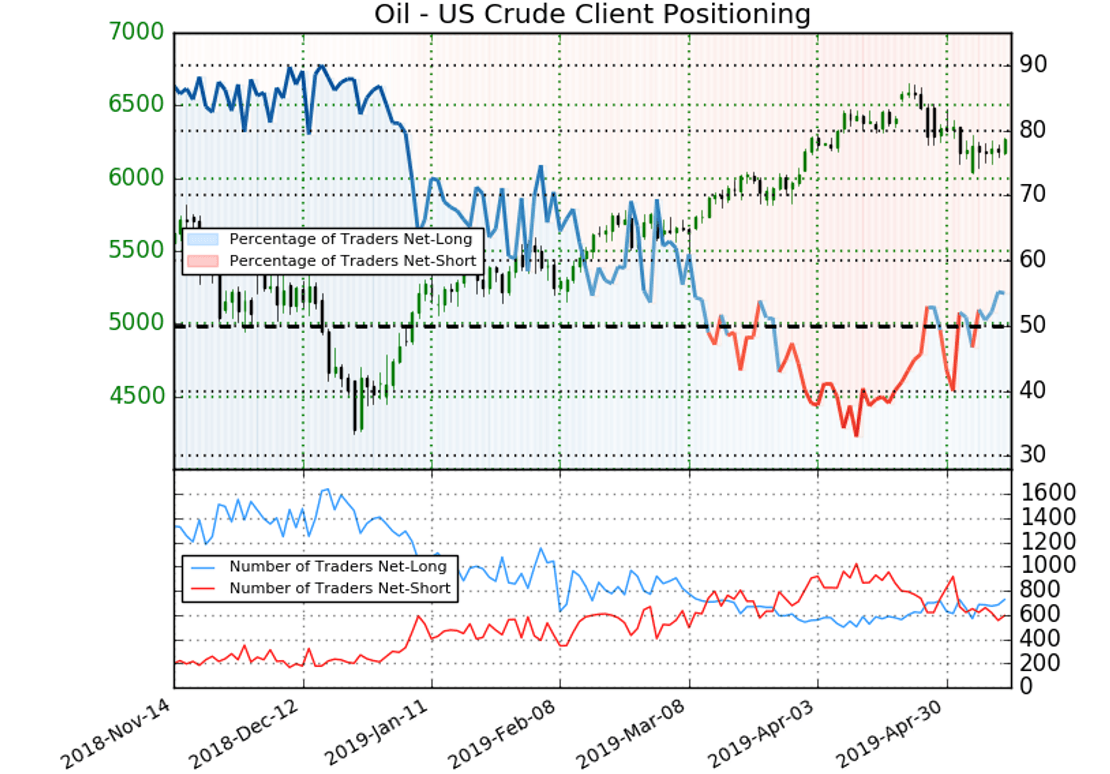
However, the 14-hour relative strength index is approaching the 70 level, suggesting that the contract is close to being overbought, and there are also warnings of a possible reaction lower from the IG Client Sentiment data.
These retail trader positioning figures show 55.0% of traders are net-long, with the ratio of traders long to short at 1.22 to 1. The number of traders net-long is 9.3% higher than yesterday and 9.8% higher from last week, while the number of traders net-short is 1.2% higher than yesterday and 0.8% lower from last week.
At DailyFX we typically take a contrarian view to crowd sentiment, and the fact traders are net-long suggests US crude prices may fall. Traders are further net-long than yesterday and last week, and the combination of current sentiment and recent changes gives a stronger bearish contrarian trading bias.
How to trade oil: crude oil trading strategies and tips
You can check out our free longer-term trading forecasts for oil and other assets here
Resources to help you trade the markets:
Whether you are a new or an experienced trader, at DailyFX we have many resources to help you:
- Analytical and educational webinars hosted several times per day,
- Trading guides to help you improve your trading performance,
- A guide specifically for those who are new to forex,
- And you can learn how to trade like an expert by reading our guide to the Traits of Successful Traders.
--- Written by Martin Essex, Analyst and Editor
Feel free to contact me via the comments section below, via email at martin.essex@ig.com or on Twitter @MartinSEssex


