

Nasdaq 100 & Dow Jones Price Forecast:
- The popular reflation trade has been put on pause for the time being as growth stocks outpace value
- Shifting fundamentals see the Nasdaq 100 retake its place as price action leader while the Dow slips
- Dow Jones Price Falls to Key Trendline as Fed Enters Taper Talk Window
Nasdaq 100 Outpaces Dow Jones as Reflation Trade is Put on Pause
If recent price moves are any indication, the Nasdaq 100 has reclaimed its throne as the leader of US equity price action as fast growing technology stocks outpace value stocks that had helped prop up the Dow Jones in recent months. The growth-to-value rotation had become known as the reflation trade and was a widely-watched stock investment trend in the first five months of the year, but has recently lost much of its steam. The shifting landscape is perhaps most evident in the Nasdaq 100 to Dow Jones ratio, a rough growth to value barometer.
Nasdaq 100 to Dow Jones Ratio: Daily Time Frame (January 2020 – June 2021)
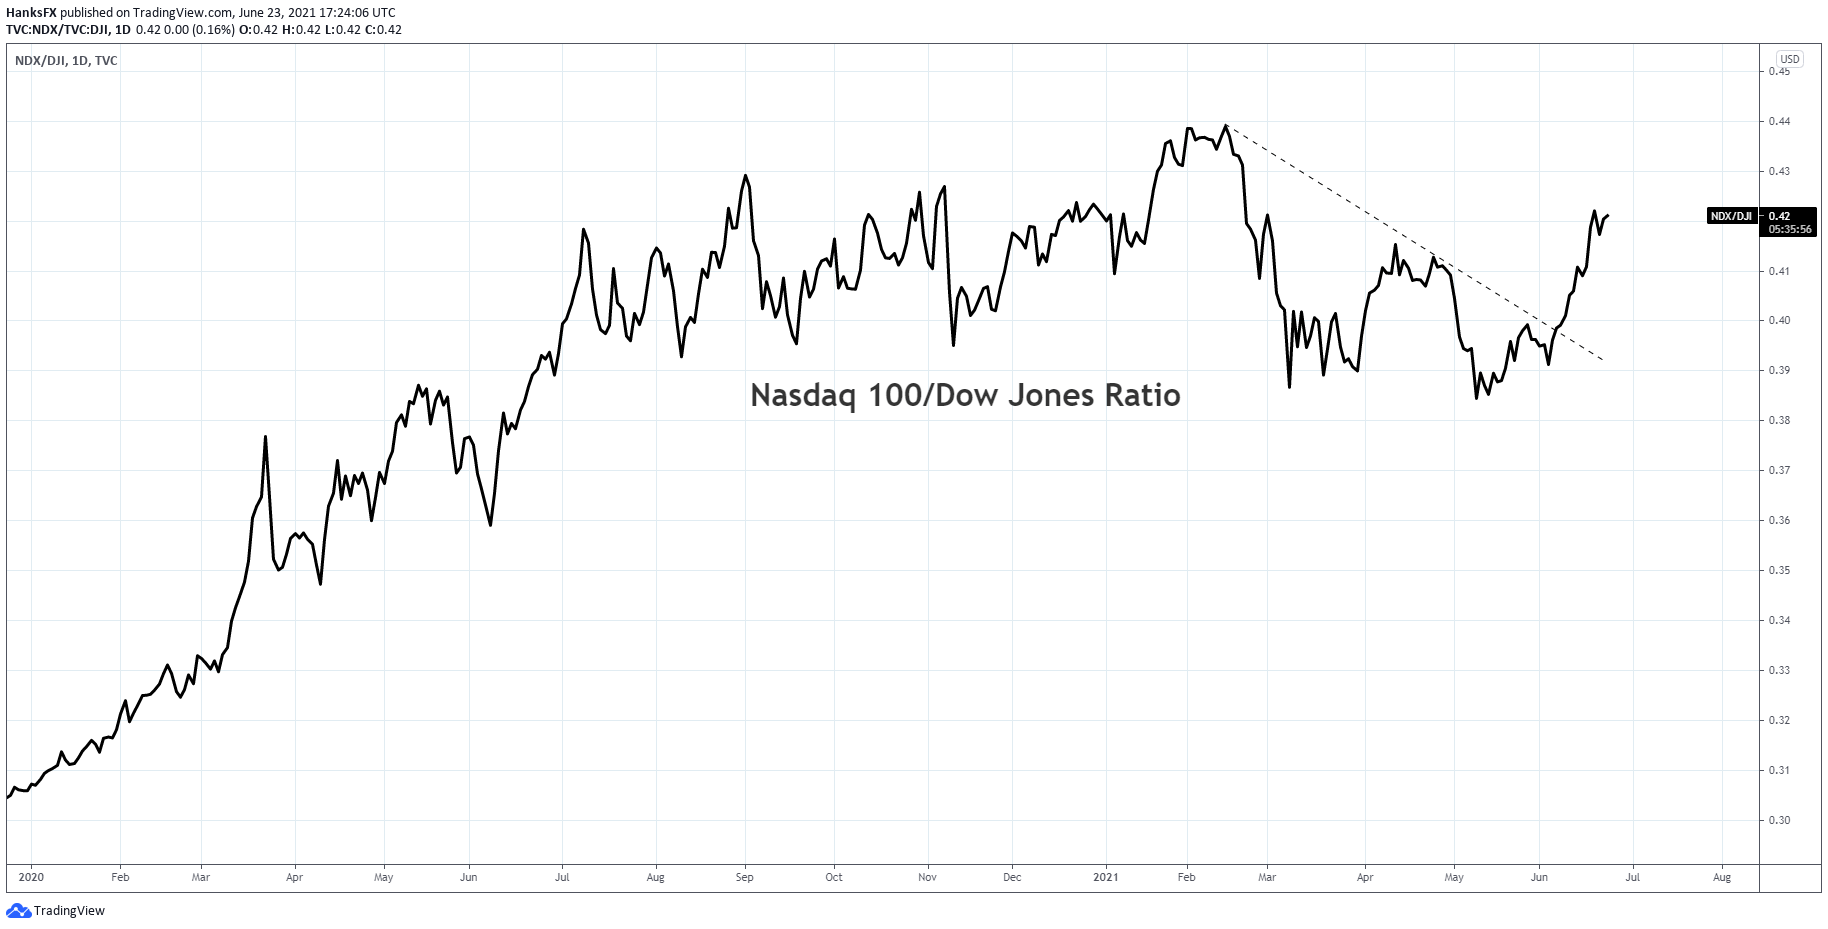
The ratio, which had been trending lower since February, tagged its highest level since February 22 this week and snapped a series of lower highs and lower lows that had materialized over the last four months in the process. While technical analysis on a ratio of two indices has limited usefulness, it does help to highlight the changing relationship which can be confirmed by looking at the Nasdaq 100 and Dow Jones price charts individually.
How to Short Sell a Stock When Trading Falling Markets
Nasdaq 100 Price Forecast
In the case of the Nasdaq 100, the tech-heavy index has established a series of fresh all-time highs after breaking above resistance early this week. With few barriers to the topside, the Nasdaq 100 may look to continue its gradual climb higher in the weeks ahead – as long as risk aversion remains at bay - and might utilize prior resistance as support going forward.
Nasdaq 100 Price Chart: 4 - Hour Time Frame (January 2021 – June 2021)
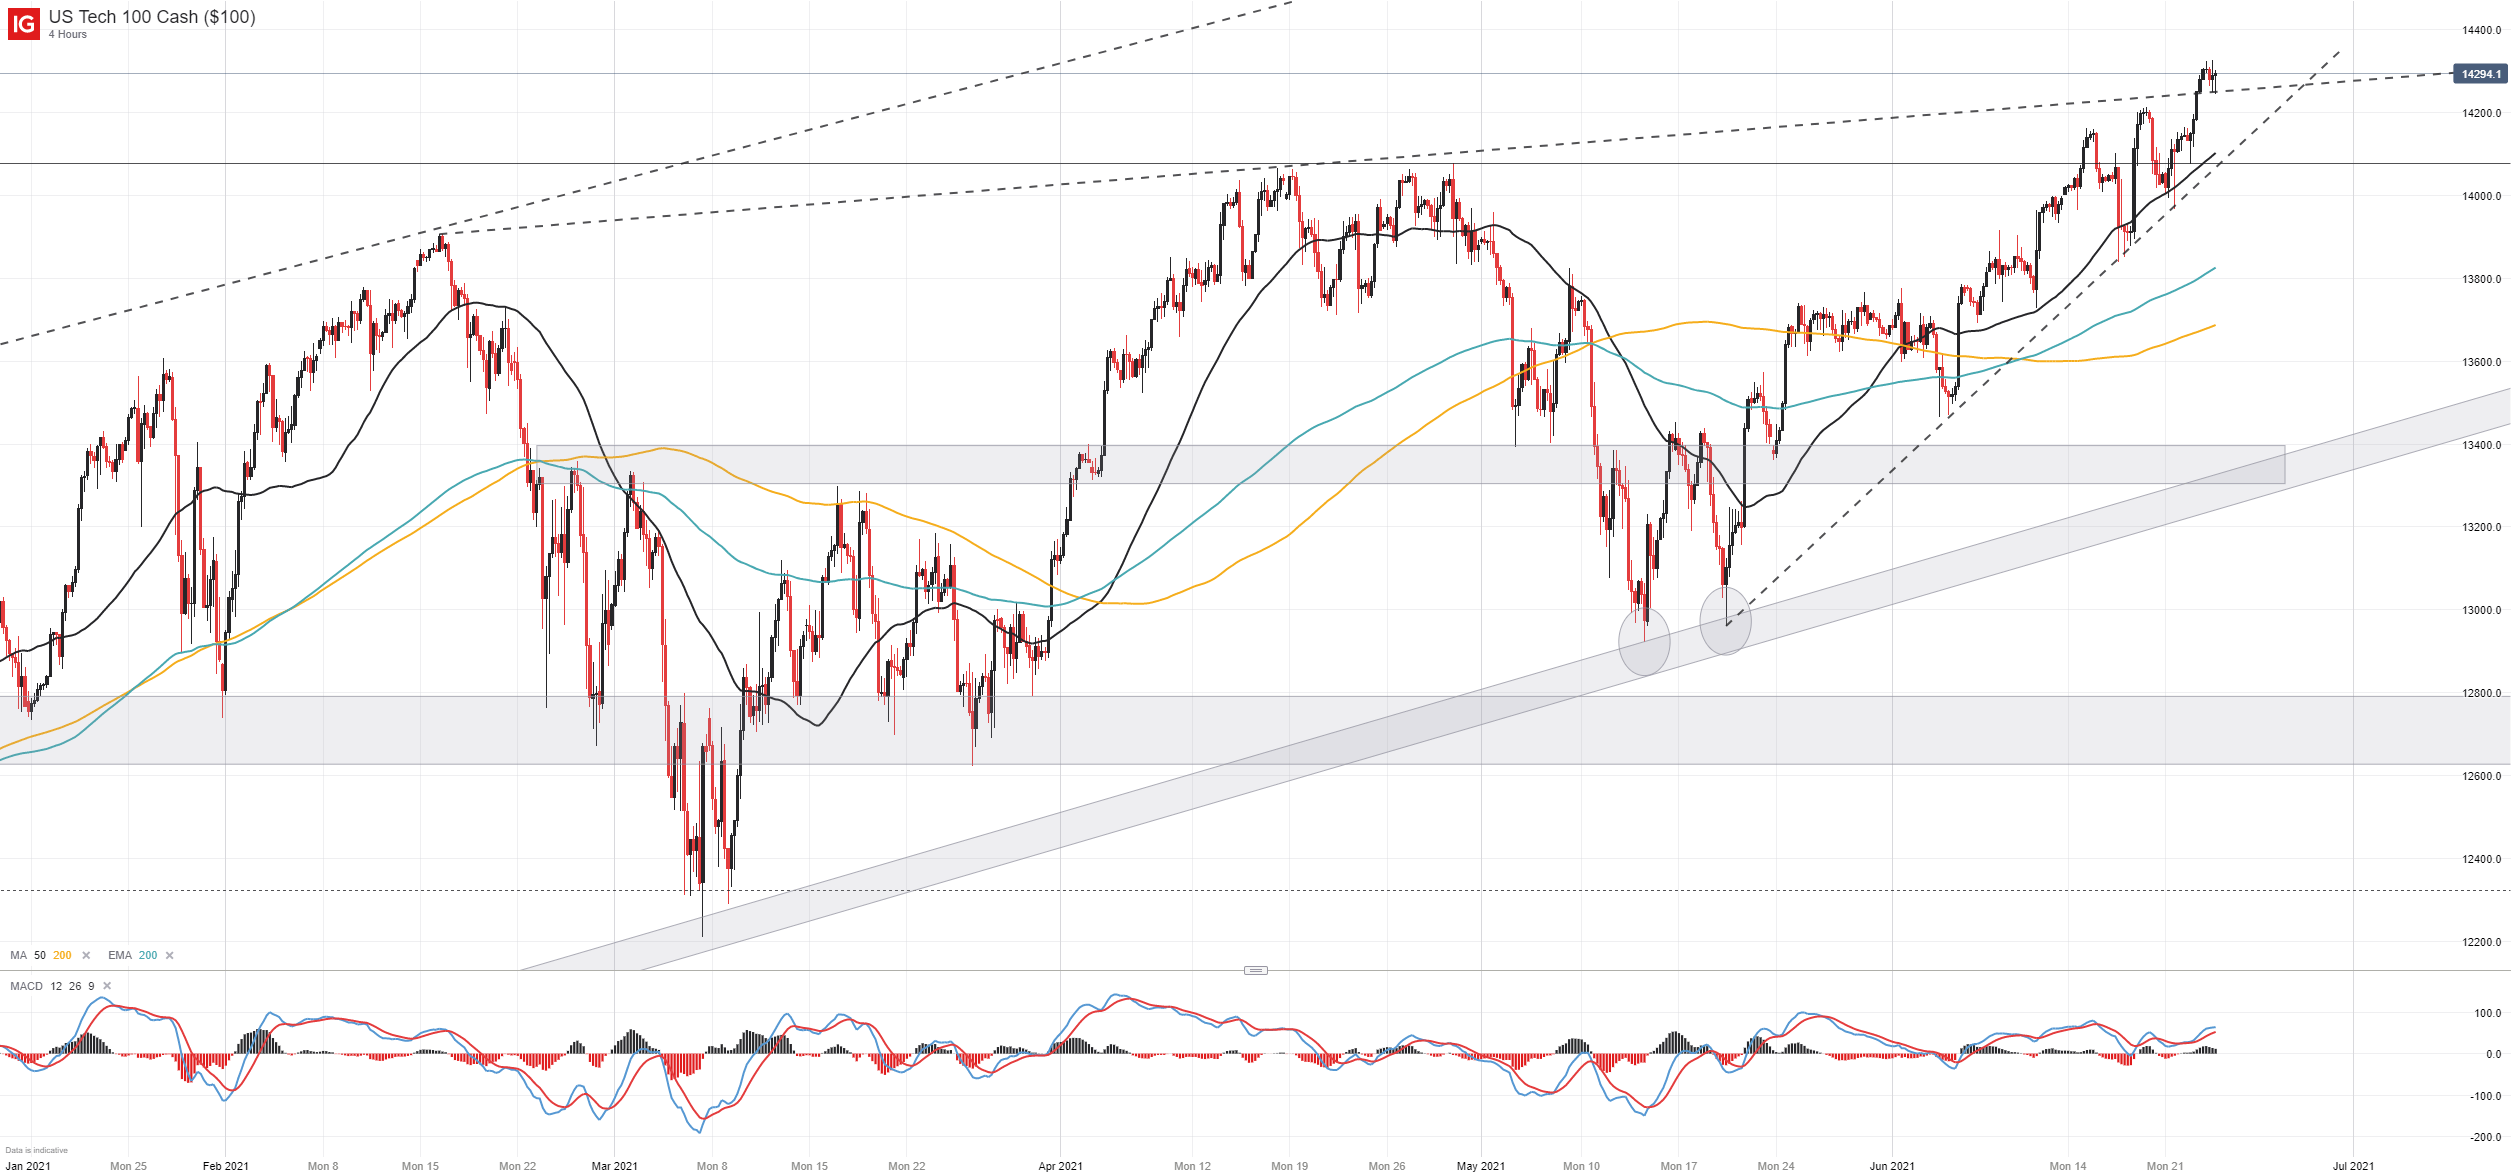
The most notable nearby support is likely derived from the rising trendline drawn off the May 19 swing low. The level coincides with various intraday lows since its inception which suggests it has helped guide the Nasdaq 100 higher. Thus, a breach of the level could see losses accelerate toward secondary support.

Dow Jones Price Forecast
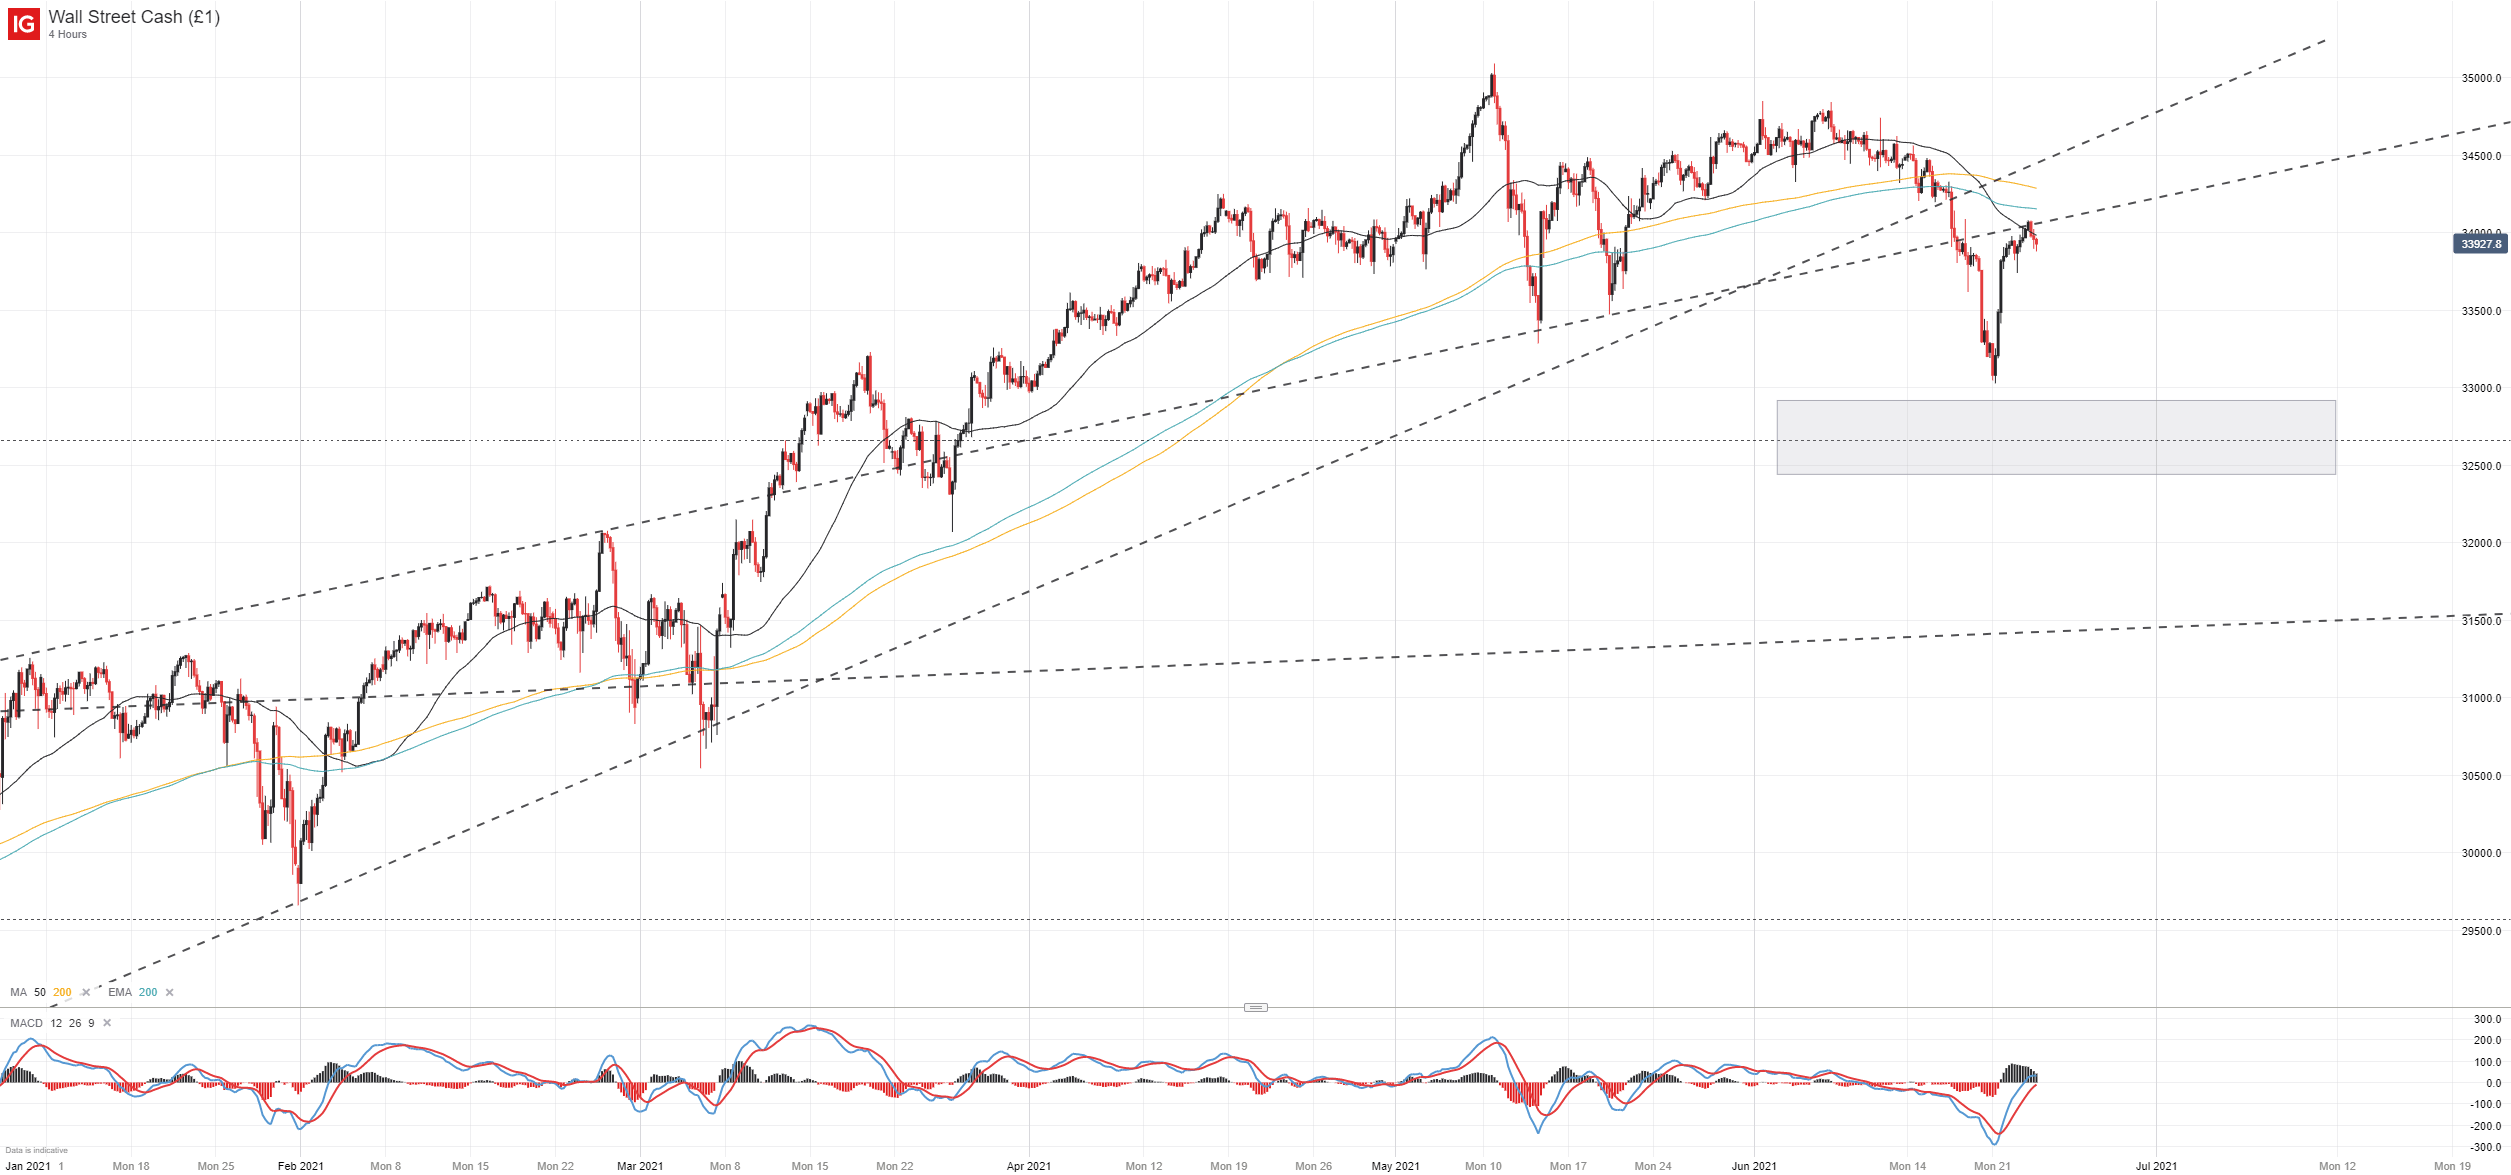
The Dow Jones, meanwhile, has forfeited its leadership position after a few months at the top and has solidified the forfeiture by surrendering a key trendline from March 2020. The break likely allowed losses to accelerate and the Industrial Average may encounter resistance at the level going forward. As a result, the Dow Jones may grasp for direction if the barrier proves insurmountable in the summer trading conditions which may allow the Nasdaq 100 to Dow Jones ratio to expand further.
Dow Jones Price Chart: 4 - Hour Time Frame (January 2021 – June 2021)
It would seem then, that recent price action and monetary policy moves have dealt a serious blow to the reflation trade – at least for now. Should runaway inflation concerns reemerge, the Dow and industrial stocks might find themselves in a position of strength yet again but that seems unlikely in the near future. Thus, equity traders might expect tech stocks to regain their appeal in the coming weeks. In the meantime, follow @PeterHanksFX on Twitter for updates and analysis.
--Written by Peter Hanks, Strategist for DailyFX.com
Contact and follow Peter on Twitter @PeterHanksFX