


CRYPTOCURRENCY MARKET OUTLOOK: BITCOIN (BTC/USD), ETHEREUM (ETH/USD) MIRED BY STIMULUS CHECKS & STRONG US DOLLAR
- Bitcoin and Ethereum have faced headwinds amid surging yields and US Dollar strength
- BTC/USD contends with a key moving average while ETH/USD forms a MACD crossover
- Crypto traders might look to fresh all-time highs with more stimulus checks on the way
- Check out the DailyFX Education Center to improve your technical analysis skills!
Bitcoin and Ethereum, the two largest cryptocurrencies by market cap, have been struggling to overcome a recent wave of selling pressure. BTC/USD price action trades roughly -12% below its record high notched last month while ETH/USD hovers about -15% off its respective peak. That said, this is notably above their latest swing lows that briefly left Bitcoin and Ethereum in bear market territory.
Piggybacking on the surge in real yields, broad-based US Dollar strength stands out as a primary catalyst weighing negatively on crypto. This has been somewhat negated by mounting private sector acceptance of Bitcoin, however. Also, with another round of stimulus checks coming down the pipeline thanks to the passage of President Biden’s $1.9-trillion covid aid package, there could be potential for another influx of demand for Bitcoin and Ethereum.
BTC/USD – BITCOIN PRICE CHART: DAILY TIME FRAME (28 NOV 2020 TO 08 MAR 2021)
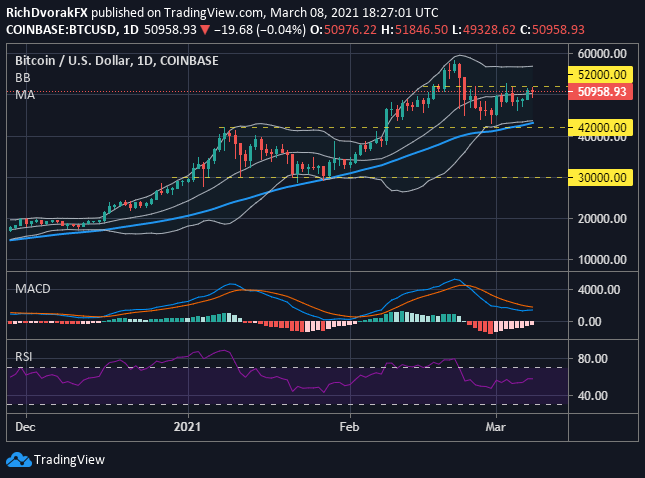
Chart by @RichDvorakFX created using TradingView
BTC/USD is currently flirting with a topside break of the $52,000-price level and its 20-day simple moving average. Eclipsing this area of technical resistance could see Bitcoin extend higher toward its upper Bollinger Band and 21 February record close. On the other hand, if Bitcoin bears attempt to wrestle back control, the 50-day simple moving average might come into focus as a potential downside objective. Breaching the $42,000-handle could open up the door to a deeper pullback toward year-to-date lows.

ETH/USD – ETHEREUM PRICE CHART: DAILY TIME FRAME (27 NOV 2020 TO 08 MAR 2021)
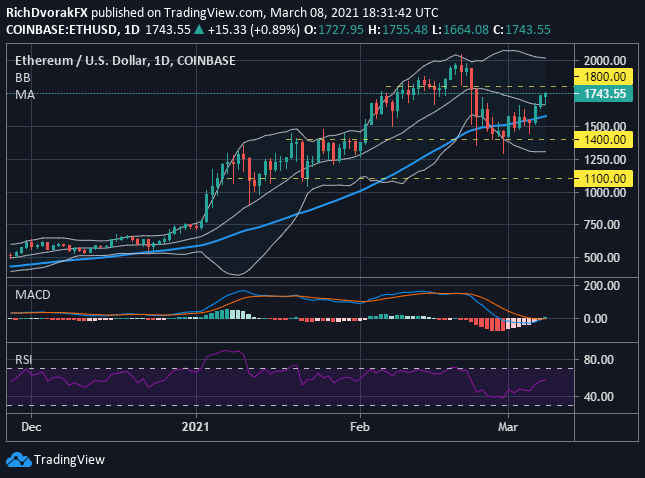
Chart by @RichDvorakFX created using TradingView
Ethereum has traded a bit more favorably over the last couple of sessions compared to its crypto cousin Bitcoin. ETH/USD price action appears perched comfortably above its 20-day simple moving average as bulls look to retain control of direction. Not to mention, a bullish MACD crossover points to potential for continuation higher. Nevertheless, failure to surmount the $1,800-price level, which roughly aligns with the 61.8% Fibonacci retracement of its latest bearish leg, could see Ethereum pivot back lower toward its key moving averages.
-- Written by Rich Dvorak, Analyst for DailyFX.com
Connect with @RichDvorakFX on Twitter for real-time market insight


