


Dow Jones Price Outlook:
- The Dow Jones capped off November with a strong finish and wades narrowly beneath all-time highs
- With a relatively sparse economic calendar, the Dow may look to technical levels for influence
- Difference between Dow, Nasdaq, and S&P 500: Major Facts & Opportunities
Dow Jones Forecast for the Week Ahead
The Dow Jones trades just narrowly beneath record levels after capping off an incredible November that saw the index surge. While a sectoral rotation trade helped propel the DJIA beyond that of the Nasdaq 100 and S&P 500 for the month, recent hopes of further covid-related stimulus have kept the Industrial Average afloat. As a result, the three indices, and the Dow in particular, rode into December on an overwhelming wave of bullish sentiment and momentum.
Dow Jones Price Chart: 4 - Hour Time Frame (September – December 2020)
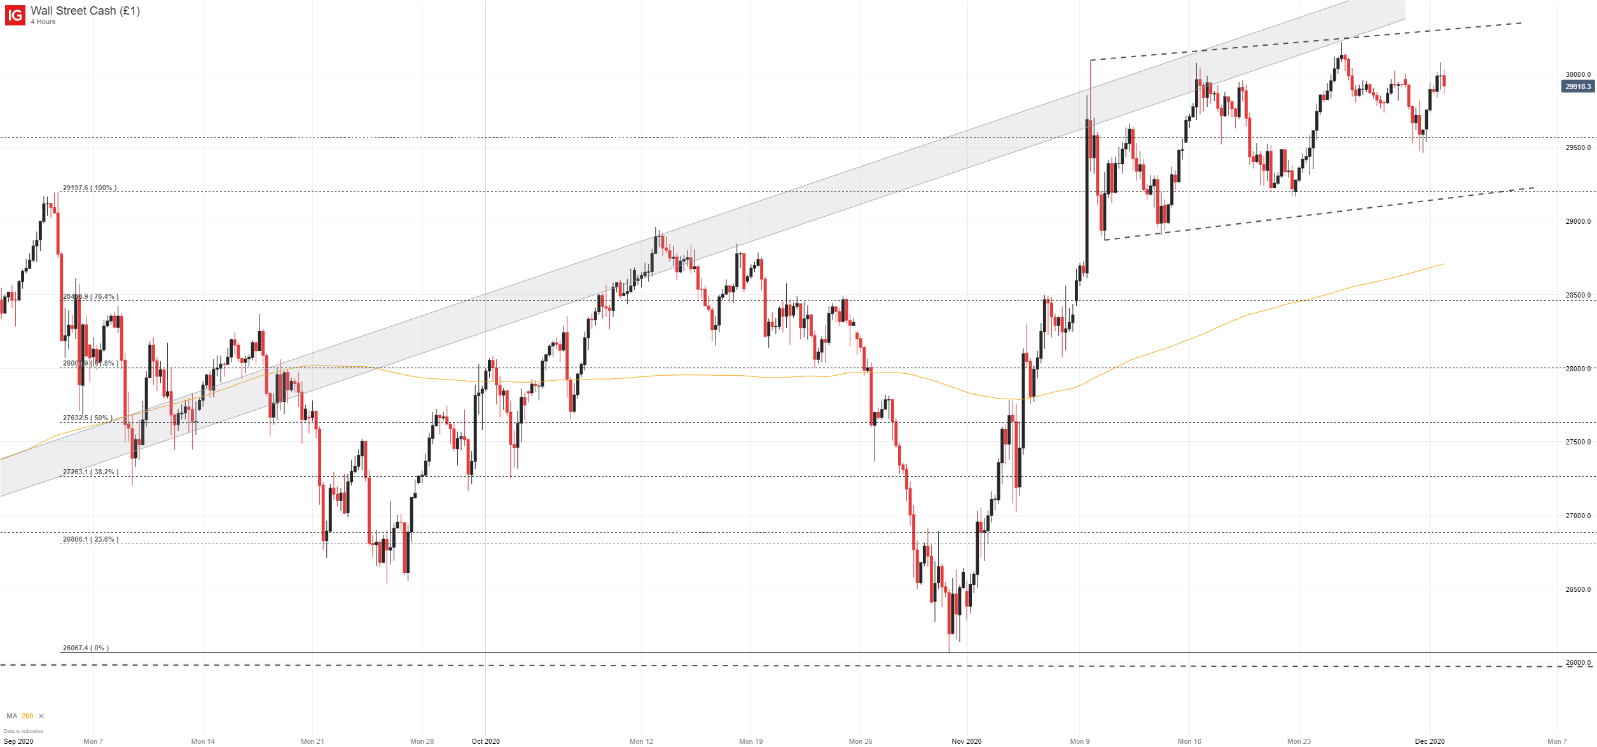
While recent consolidation might hint at waning momentum, the series of higher-lows and higher-highs is an encouraging sign for the Dow in the weeks ahead. Since seasonal trends and a lack of fundamental catalysts might seen volatility and price action slow, however, the current landscape of the DJIA may lend itself to range trading strategies as it awaits further fuel to push higher over the longer-term.
Top 8 Forex Trading Strategies and their Pros and Cons – Range Trading Included!
To that end, the Dow has carved out an ascending channel marked by various swing-highs and lows throughout November. This formation might look to keep the DJIA contained barring a concrete change in the fundamental landscape, meaning resistance around the 30,220 level will be an early barrier for the index.
In terms of support, initial buoyancy might be found at the Fibonacci level around the 29,560 level followed by 29,200 and 28,865. While 29,560 and 29,200 rest within the trading range, a test of 28,865 would mark an exit from the pattern and could open the door to further losses – meaning 28,865 could be the line in the sand in the shorter-term.
| Change in | Longs | Shorts | OI |
| Daily | -20% | 11% | -1% |
| Weekly | -20% | 17% | 1% |
Either way, IG client sentiment data reveals retail traders remain net-short the Dow Jones Industrial Average although the ratio is dropping. The number of traders net-long is 20.90% lower than yesterday and 3.31% higher from last week, while the number of traders net-short is 21.43% higher than yesterday and 18.09% lower from last week. Since we typically take a contrarian view to crowd sentiment, this data might suggest the Dow is tilted higher.
--Written by Peter Hanks, Strategist for DailyFX.com
Contact and follow Peter on Twitter @PeterHanksFX t


