


Gold Price Outlook:
- Gold fell more than -4% in September, even as volatility sparked demand for safe haven assets
- More recently, however, XAU/USD has recovered and nears technical resistance as a result
- Will gold continue its recent recovery or will bears return near resistance and drive price lower?
Gold Price Forecast: XAU/USD Climbs to Resistance, Will it Rally?
Gold suffered a string of losses in September and closed more than -4% lower for the month. While the fundamental outlook has undergone little change in that timeframe, recent US Dollar strength may have played a role in gold’s weakness. Either way, gold has begun to show symptoms of a recovery rally and technical resistance stands narrowly overhead. Can gold break above?
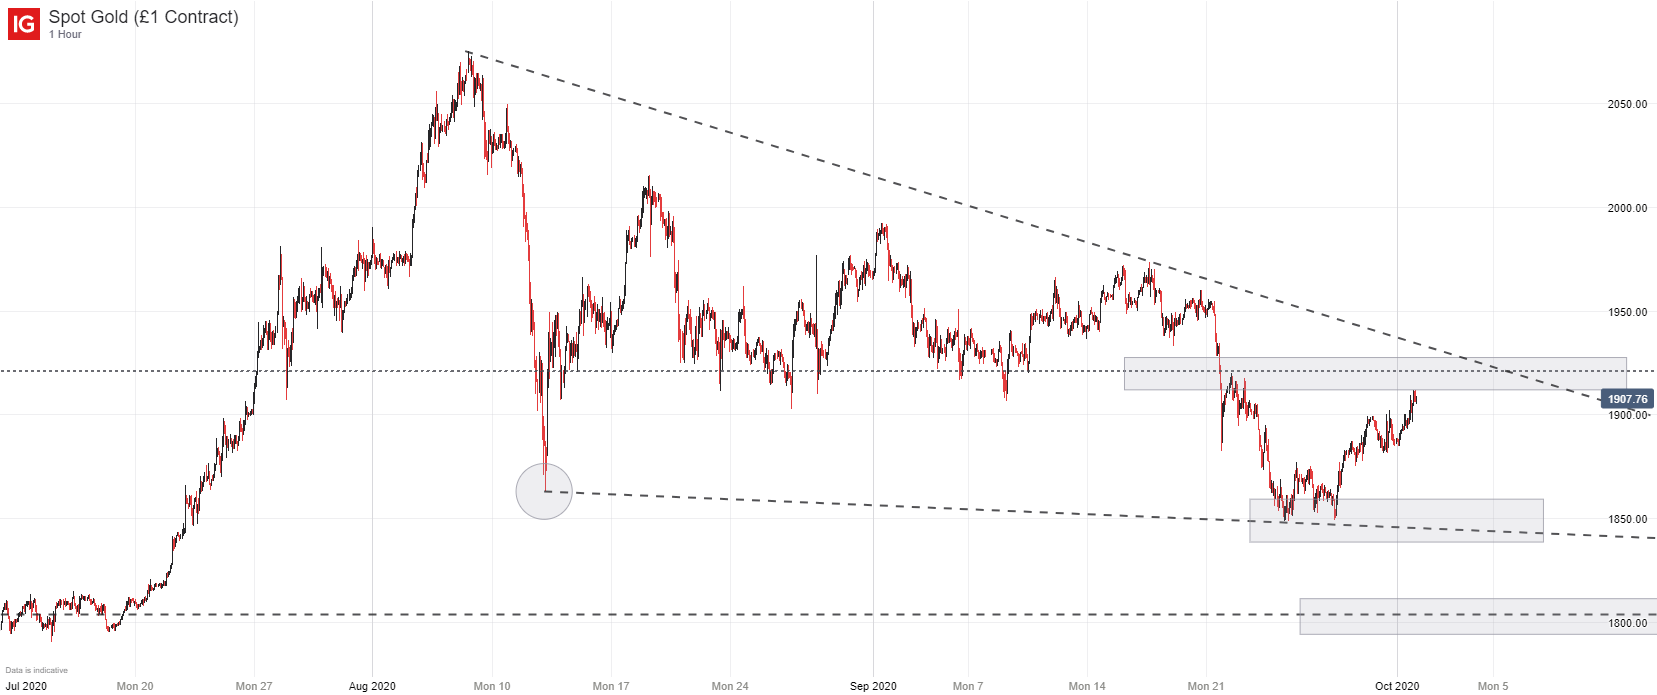
Gold (XAU/USD) Price Chart: 1 – Hour Time Frame (July 2020 - October 2020)
Well, one consideration to be made is the longer-term outlook. In my opinion, the fundamental landscape has culminated a perfect storm for gold price strength as the Fed looks to keep lower rates for longer and let inflation run above target. Thus, recent losses might be viewed as mere consolidation before an extension higher. That said, gauging the depth of consolidation is an important aspect when pondering long-exposure.
View our Podcast Episode on Risk Trading and Safe Havens
To that end, overhead resistance around the $1,921 mark could play an important role in the days ahead. Should bullish intent fizzle out at the technical barrier, bears might return to the fray and pressure gold prices once more. In that case, a return to potential support around the $1,845 area becomes a possibility. If broken, gold may succumb to further losses as it looks for subsequent support around the $1,800 mark.

As bulls and bears battle it out in the days ahead, the technical formation on the gold price chart has evolved into a falling wedge which is often viewed as a bullish continuation pattern. Still, technical formations do not always play out in line with their definitions, so suggesting a rally is imminent is presumptuous – albeit possible. Suffice it to say, how gold traders react to the $1,921 level may provide key insight into the direction of gold prices in the coming days. In the meantime, follow @PeterHanksFX on Twitter for updates and analysis.
--Written by Peter Hanks, Strategist for DailyFX.com
Contact and follow Peter on Twitter @PeterHanksFX


