


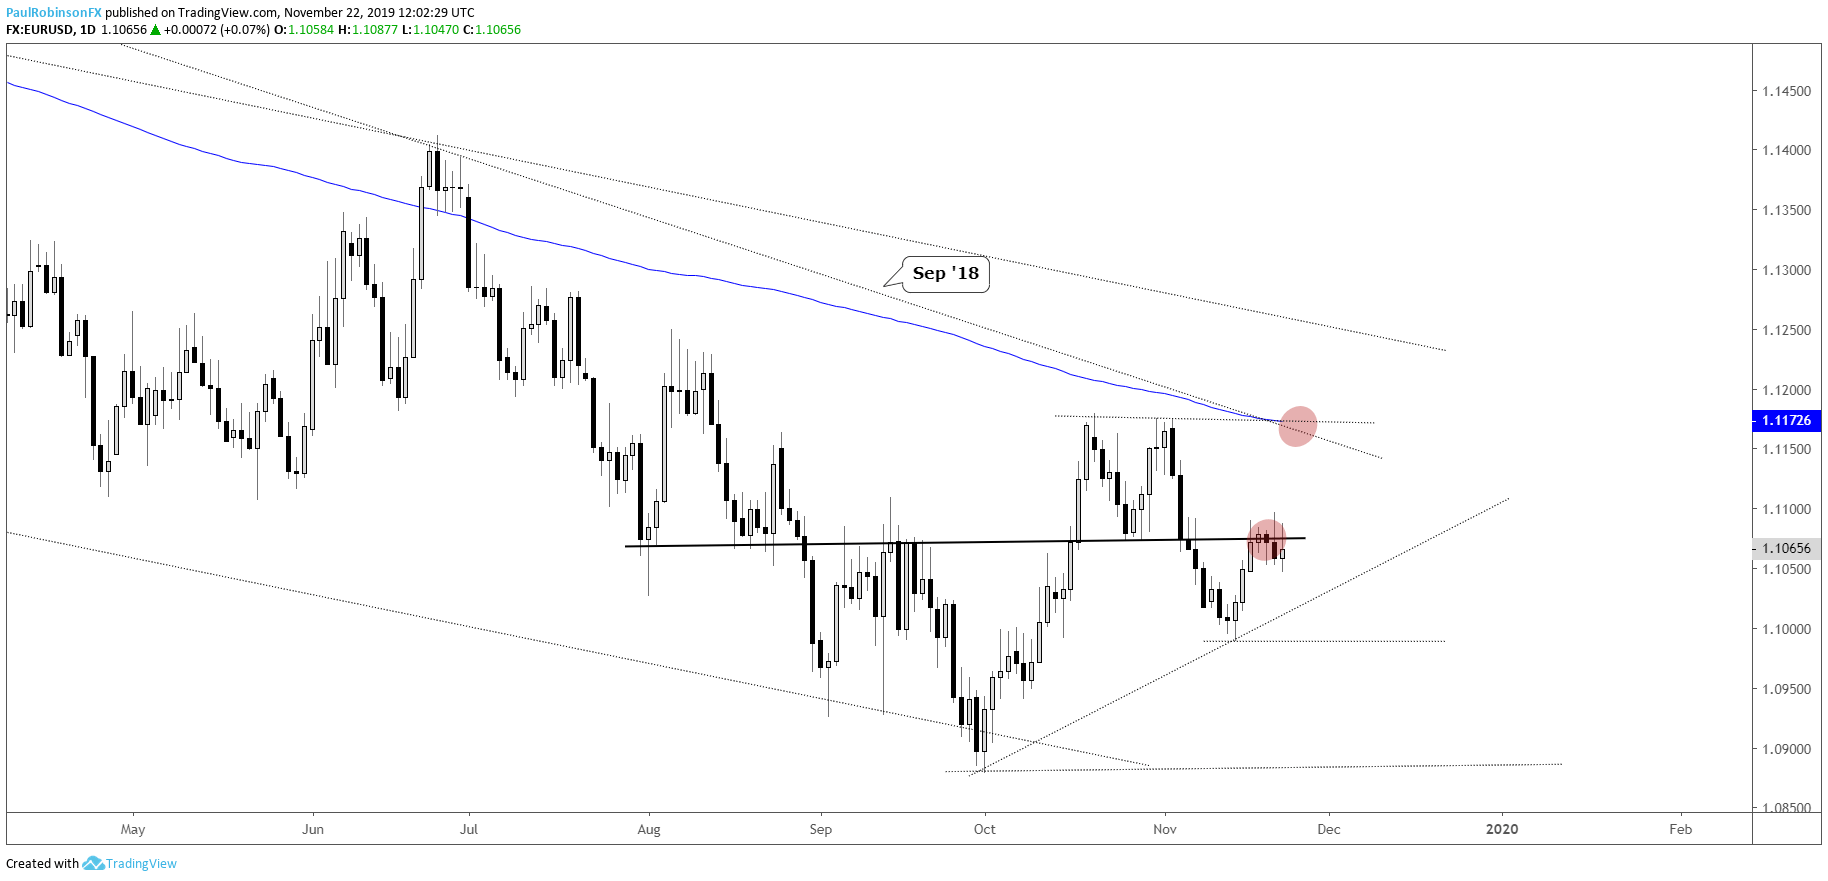
EUR/USD is finding it difficult to rise above a threshold we’ve had penciled in as resistance around the 11072 level. There have been several intra-day attempts to rally above but all have failed to close below. The minor reversals we are seeing suggests a push lower could come soon.
Looking lower, there is the trend-line off the October low to take into consideration, but at this time it isn’t viewed as a strong form of support. Below there, 10989, the monthly low, is the first meaningful level of support. Break that and down to the cycle low under 10900 in September looks to be the next move. To turn the picture bullish a lot of work will be needed given that the broader trend is lower.
EUR/USD Daily Chart (trend lower may resume soon)
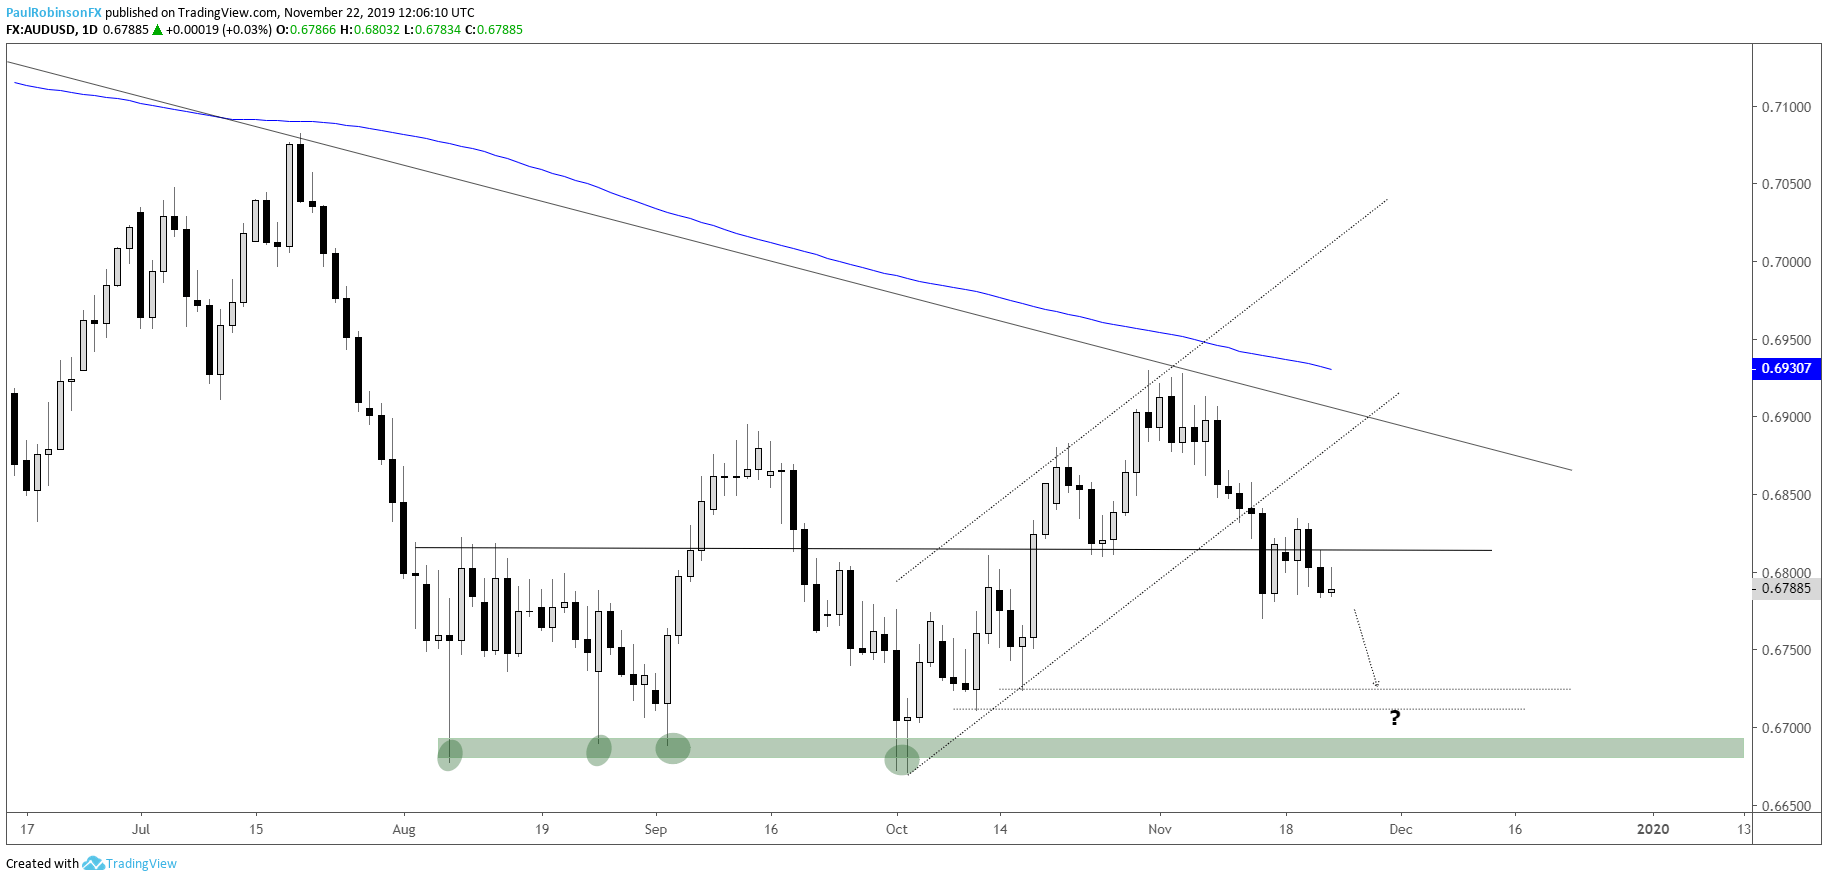
AUD/USD has a line running right around the 6800-threshold, the pair has danced around it the past few days. Overall, though, Aussie looks headed lower as the broader trend is lower as well as the one off the October 31 high. Looking lower, minor support clocks in at 6723/10, followed by strong support around the 6700 line down to 6670.
AUD/USD Daily Chart(6700 or worse may soon be in store)
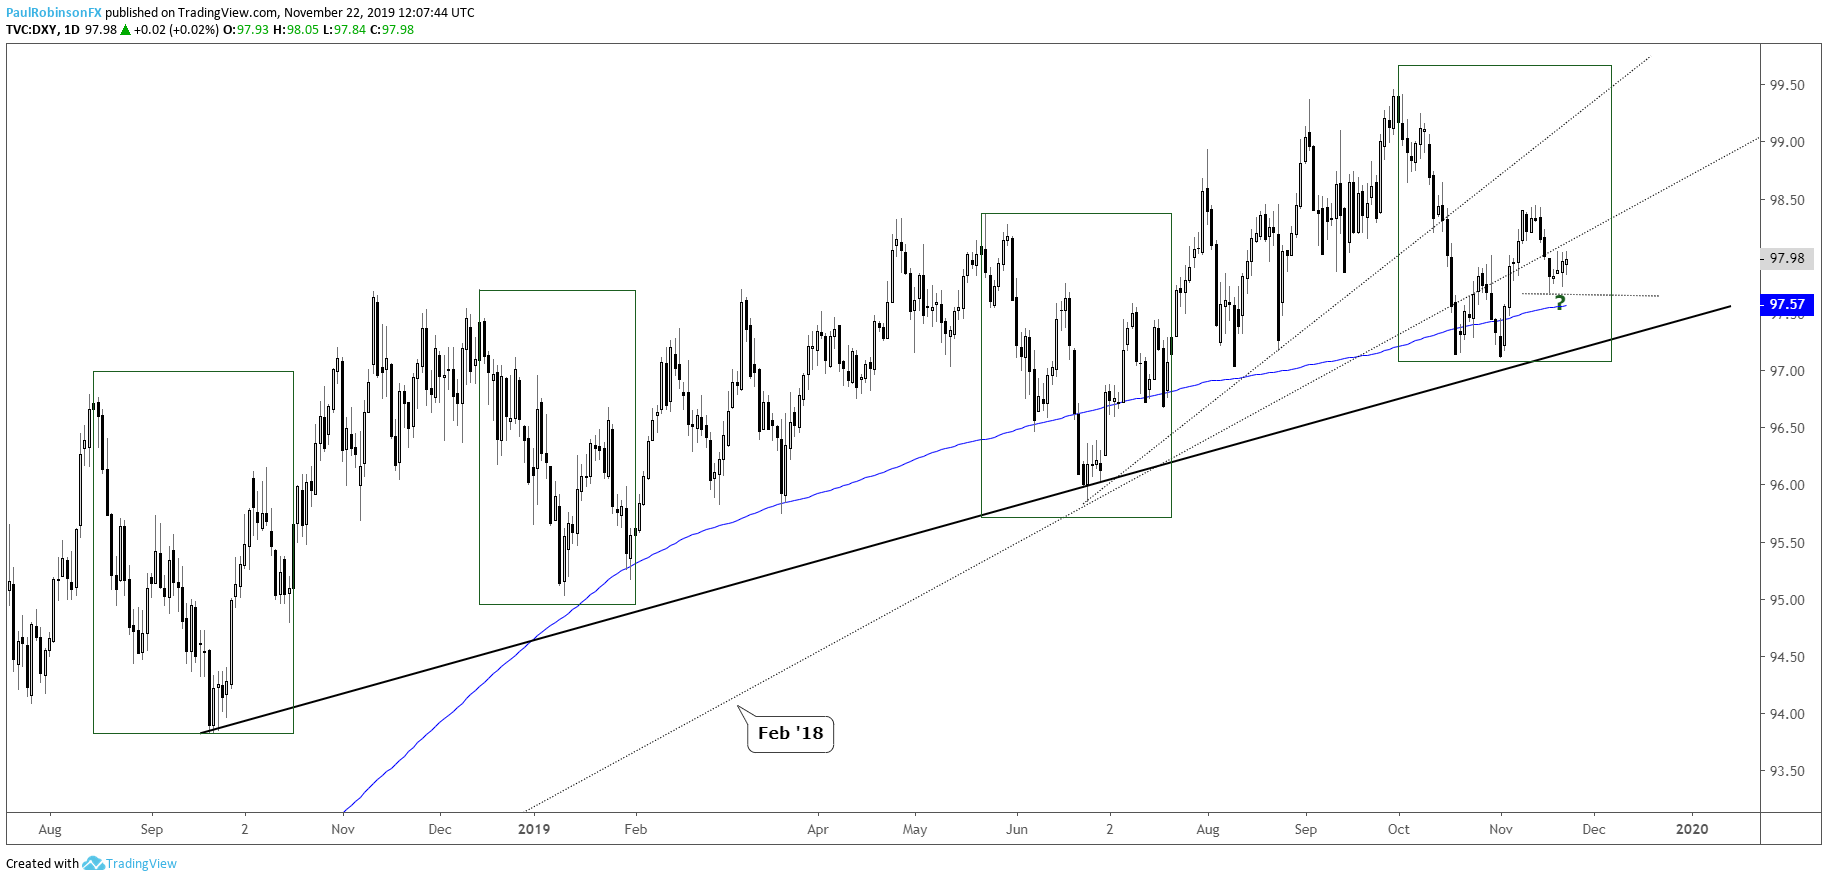
The US Dollar Index (DXY) may have carved its pullback low this week, a higher-low from the low created on the first day of the month. This could set up the index to rally in similar fashion as it has over the past 14 months after carving out a strong swing-low (i.e. – Nov 1 low).
If this is to be the case, then the DXY should soon rally beyond 98.45 and gain traction for a move back towards the October 1 high at 99.67. In this low-volatility environment that feels like a big ask, but certainly doable in the weeks ahead of the new year.
DXY Daily Chart(higher-low may be forming for new leg)
US Dollar Index (DXY) Chart by TradingView
For the full set of technical details and charts, check out the video above…
Resources for Index & Commodity Traders
Whether you are a new or an experienced trader, DailyFX has several resources available to help you; indicator for tracking trader sentiment, quarterly trading forecasts, analytical and educational webinars held daily, and trading guides to help you improve trading performance.
We also have a series of guides for those looking to trade specific markets, such as the S&P 500, Dow, DAX, gold, silver, crude oil, and copper.
---Written by Paul Robinson, Market Analyst
You can follow Paul on Twitter at @PaulRobinsonFX


