


US DOLLAR OUTLOOK: USD PRICE ACTION UNDER PRESSURE – WILL SUPPORT HOLD?
- US Dollar strength faded across the board throughout Wednesday’s trading session
- The DXY Index rejected its 50-day simple moving average and NZD/USD skyrocketed
- Durable goods, month-end flows, potential fiscal stimulus setbacks come into focus
- Learn more about technical analysis or implied volatility trading strategies!
The US Dollar whipsawed on Wednesday as initial strength was faded by bears. On net, the broader US Dollar Index edged slightly lower with gains against JPY and CHF largely offset by weakness versus the EUR, GBP, and CAD. The intraday reversal appeared to follow 10-year Treasury yields peeling back from the 1.40% mark.

DXY INDEX PRICE CHART: DAILY TIME FRAME (26 NOV 2020 TO 24 FEB 2021)
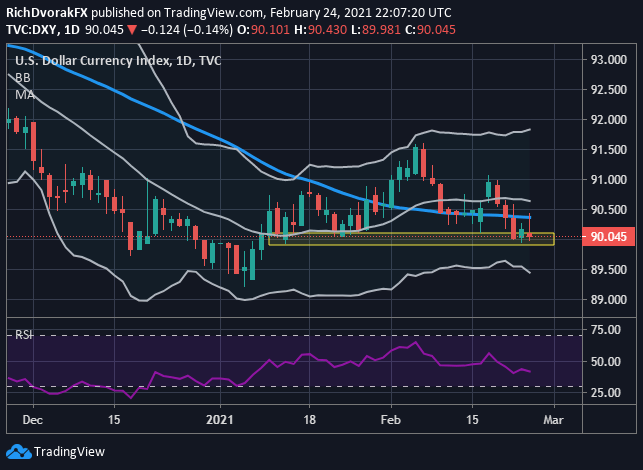
Chart by @RichDvorakFX created using TradingView
Early US Dollar strength also fizzled out after a rejection of its 50-day simple moving average. The pivot to the downside sends the DXY Index back to a critical technical support zone underpinned by the 90.00-price level. A breakdown of this support level could see the bottom Bollinger Band eyed as a potential downside objective for US Dollar bears. On the other hand, surmounting the 50-day simple moving average might open up the door to a test of the 91.00-handle.
USD PRICE OUTLOOK – US DOLLAR IMPLIED VOLATILITY TRADING RANGES (OVERNIGHT)
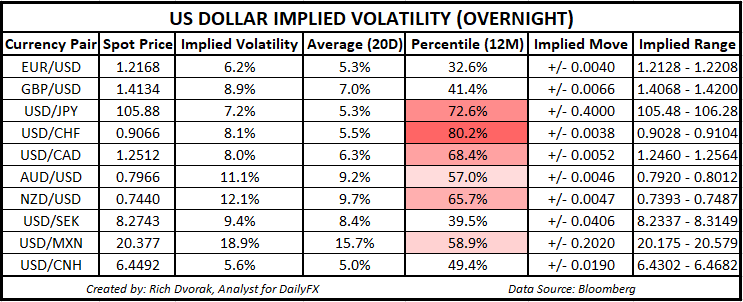
Currency volatility is expected to continue heating up into Thursday’s session judging by overnight US Dollar implied volatility readings. Looking to the DailyFX Economic Calendar, we see high-impact event risk posed by the release of monthly durable goods orders data scheduled for release 25 February at 13:30 GMT. With only two more trading days left until March, month-end rebalancing might weigh on USD price action as well.
Not to mention, centrist democratic Senator Joe Manchin might create some headwinds to passing President Joe Biden’s $1.9-trillion fiscal stimulus package. This potential catalyst could test the patience of US Dollar bears currently expecting a stimulus deal to be finalized by mid-March, though it may provide an opportunity to fade possible bouts of strength.
Keep Reading - New Zealand Dollar Outlook: NZD/USD Soars on RBNZ Housing Remit
-- Written by Rich Dvorak, Analyst for DailyFX.com
Connect with @RichDvorakFX on Twitter for real-time market insight


