


US Dollar Forecast Overview:
- The US Dollar (via the DXY Index) has quickly exited its multi-month consolidation to the downside, but USD/JPY has not traded lower.
- Why? Safe haven currencies are being jettisoned as developed economies are moving towards re-opening after the coronavirus pandemic. Gains by equity markets and weakness in gold prices is hurting the Japanese Yen.
- Retail trader positioning suggests that USD/JPY may still trade higher, although the other major USD-pairs have less rosy outlooks.

US Dollar Under Siege as Euro’s Problems Dissolve
As protests and riots spread across the United States following the murder of George Floyd, a strange feeling has spread across financial markets: maybe the worst of the coronavirus pandemic is behind us. It may be the case that, with throngs of people pouring into the streets – in stark contradiction to the dire stay-at-home lockdowns – the United States has ‘ripped off the band-aid,’ serving as real-life petri dish for re-opening.
So we’re now counting down the clock for two weeks’ time, the incubation period for COVID-19, to see if new cases and hospitalizations start to rise anew. And this may be the curious silver lining to the recent unrest in the United States, from the financial markets’ perspective: if we don’t see a jump in new coronavirus cases by mid-June, then the hope for a V-shaped recovery will be in full throttle.
For the US Dollar (via the DXY Index), it’s easy to assign the recent protests and riots as the reason for its recent slide. Yet the developments around its largest component, the Euro, would dictate a weaker DXY Index anyhow: the move towards fiscal union is a bonafide gamechanger.
The mix of Europe backing away from an existential crisis coupled with fresh reasons to hope that the coronavirus pandemic is subsiding has let to a surge in risk appetite in recent days, sending investors fleeing from safe haven assets into higher yielding, riskier opportunities. To this end, while currencies like the Japanese Yen and US Dollar have suffered, others like the Australian and Canadian Dollars have surged.
US Treasury Yield Curve Continues to Normalize
The US Treasury yield curve has certaintly normalized relative to where it was in mid-March, no doubt thanks to the extraordinary policy steps taken by the Federal Reserve. As we learned from The Great Recession, companies that are facing liquidity issues in the short-term can easily be swept up in the tides of insolvency if aggressive, heavy handed measures are not taken swiftly and upfront; the policy response cannot be a slow drip. Thus, the normalization of the US Treasury yield curve is an intentional, if not artificial outcome.
US Treasury Yield Curve: 1-month to 30-years (June 3, 2020) (Chart 1)
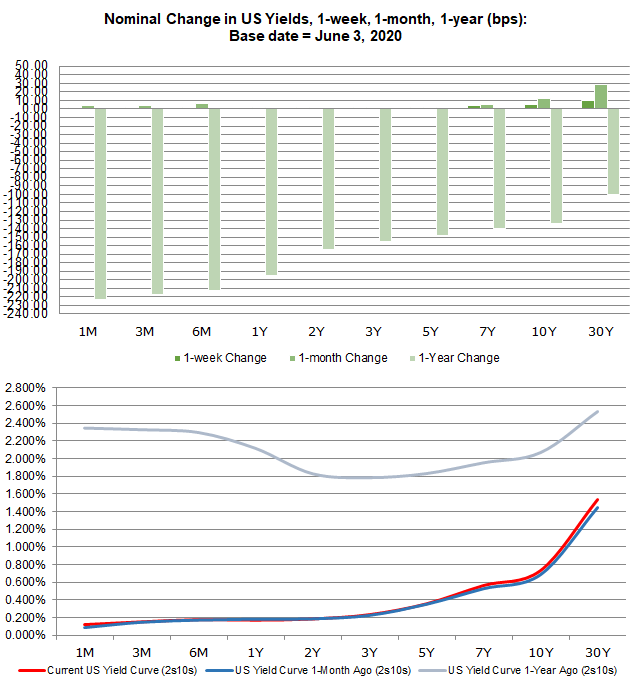
That said, there is some slight twisting occuring at the short-end of the US yield curve, with the 1m12m spread narrowing over the past month. But the long-end of the yield curve is rising faster than the short-end; this bear steepening is often a sign of more optimistic tendencies on behalf of investors. Considering we’re now in the live petri dish of re-opening in perhaps the most aggressive manner possible in the United States, investors may be positioning themselves for a sharper rebound in US growth in Q3’20.
Fed Rate Cuts Done; New Measures More Likely
It still holds that, with the Federal Reserve already having enacted emergency interest rate cut measures, rate markets are more or less stuck in a state of suspended animation. If the Fed is going to do anything from here on out, it’s going to come via more QE, a repo facility, etc. The latest extraordinary effort, the Municipal Liquidity Facility, is an example of this effort, which has been expanded to cover most metropolitan areas in the United States. Now, the Fed’s balance sheet is above $7 trillion.
Federal Reserve Interest Rate Expectations (June 3, 2020) (Table 1)
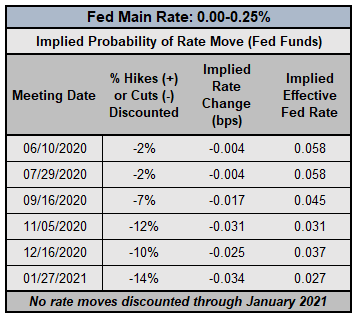
There’s been no indication that the Fed plans on moving rates into negative territory, and as a result, we’ve reached the lower bound for the time being. To this end, any suggestions by rates markets that a rate hike is coming anytime soon is a pricing quirk to be ignored: interest rates are not going anywhere higher, at least through January 2021.
DXY PRICE INDEX TECHNICAL ANALYSIS: DAILY CHART (July 2019 to April 2020) (CHART 2)
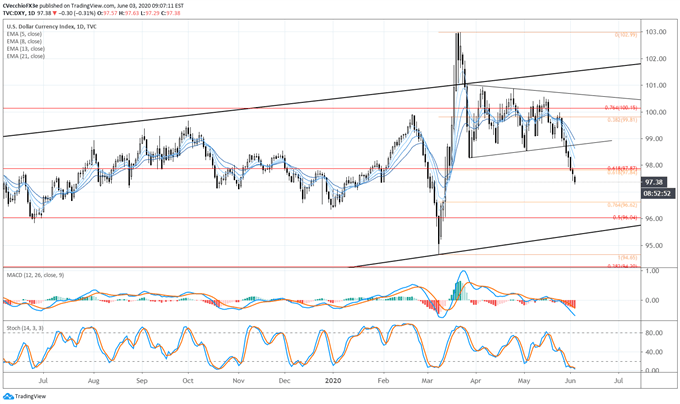
The DXY Index’s lack of direction in since late-March formed into a symmetrical triangle on the daily timeframe, yielding a breakdown in the past week. During the breakdown, while the DXY Index has moved below the 61.8% retracement of the 2020 low/high range, bearish momentum has accelerated significantly with price now below the daily 5-, 8-, 13-, and 21-EMA envelope. Daily MACD continues to decline while in bearish territory, while Slow Stochastics is holding in oversold territory. More losses appear likely in the near-term; the 76.4% retracement of the 2020 low/high range comes in at 96.62.
DXY PRICE INDEX TECHNICAL ANALYSIS: WEEKLY CHART (November 2016 to June 2020) (CHART 3)
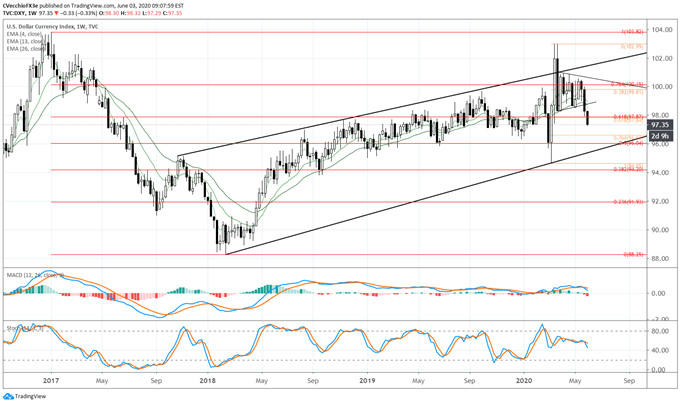
A re-drawn weekly timeframe shifts our attention from a potential bearish rising wedge from the 2018 low to a rising channel instead, with support coming in at the March 2020 low. To this end, the loss of the multi-month consolidation, in context of failure to climb through channel resistance, suggests that a deeper pullback towards channel support may be in the works. Over the next few weeks, traders may look as far as the 50% retracement of the 2017 high/2018 low range at 96.04 as significant support.
USD/JPY RATE TECHNICAL ANALYSIS: DAILY CHART (July 2019 to June 2020) (CHART 4)
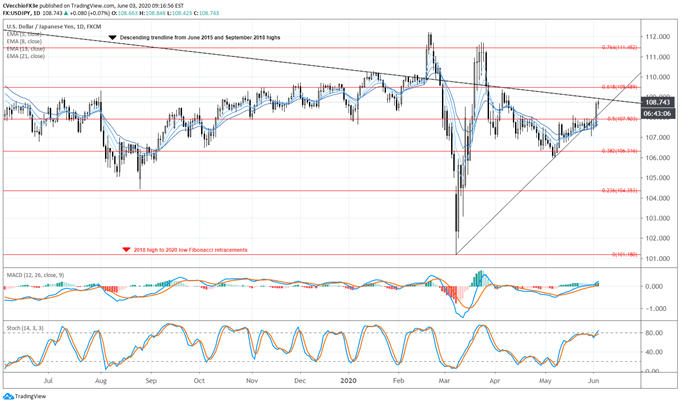
USD/JPY’s gains in recent days has seen the pair retake the rising trendline from the March and May lows, in effect tracking both the move higher by US equity markets and the move lower by gold prices. The swell in risk appetite amid hopes that The Great Lockdown has been sequestered to the history books has come at the detriment of both the US Dollar and the Japanese Yen.
The fundamental context, with the Japanese economy already in recession pre-coronavirus, there is a strong chance that the Bank of Japan will be stepping up its easing efforts in the coming months, further incentivizing traders to reduce their holdings of the low yielding, safe haven currency.
To this end, the momentum profile for USD/JPY rates is becoming more bullish. USD/JPY rates are above the daily 5-, 8-, 13-, and 21-EMA envelope, which has aligned in bullish sequential order. Daily MACD continues to glide above its signal line, while Slow Stochastics have risen into overbought territory. Gains through 109.00 would see the descending trendline from the June 2015 and September 2018 highs broken, a favorable development for USD/JPY bulls.
IG Client Sentiment Index: USD/JPY RATE Forecast (June 3, 2020) (Chart 5)
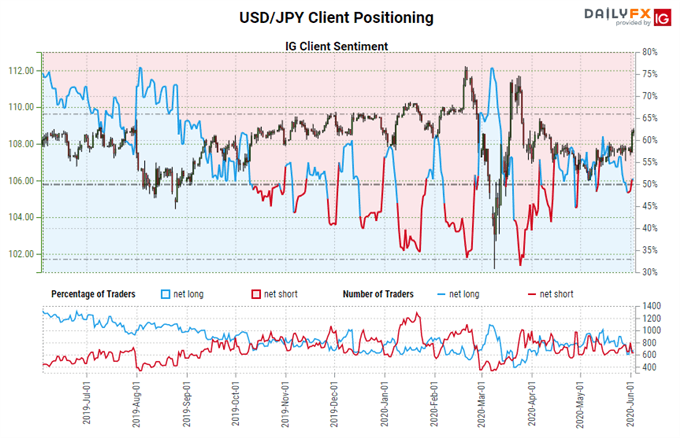
USD/JPY: Retail trader data shows 53.19% of traders are net-long with the ratio of traders long to short at 1.14 to 1. The number of traders net-long is 4.48% lower than yesterday and 5.77% lower from last week, while the number of traders net-short is 17.18% lower than yesterday and 5.06% lower from last week.
We typically take a contrarian view to crowd sentiment, and the fact traders are net-long suggests USD/JPY prices may continue to fall.
Positioning is more net-long than yesterday but less net-long from last week. The combination of current sentiment and recent changes gives us a further mixed USD/JPY trading bias.

--- Written by Christopher Vecchio, CFA, Senior Currency Strategist


