


Japanese Yen Talking Points
USD/JPY continues to pullback from the monthly high (109.79) to largely mirror the recent weakness in longer-dated US Treasury yields, and the Federal Open Market Committee (FOMC) Minutes may generate a larger correction in the exchange rate as the central bank remains reluctant to adjust the forward guidance for monetary policy.
USD/JPY Mirrors Decline in US Treasury Yields Ahead of FOMC Minutes
USD/JPY extends the series of lower highs and lows from the latter half of last week after showing a limited reaction to the US Retail Sales report, and the exchange rate may continue to trade within the confines of the April range as it falls back towards the 50-Day SMA (109.06).

The FOMC Minutes may reflect a dovish forward guidance as the central bank braces for a transitory rise in inflation, and it remains to be seen if the slowdown in Retail Sales will encourage the committee to retain the current course for monetary policy as household consumption holds flat in April after expanding a revised 10.7% the month prior.
Recent remarks from Fed Governor Christopher Waller suggests the central bank will continue to utilize its emergency tools as the permanent voting-member on the FOMC argues that “we need to see more data confirming the economy has made substantial further progress before we adjust our policy stance,” and Chairman Jerome Powell and Co. may stick to the same script at its next interest rate decision on June 16 as the major of Fed officials
Until then, USD/JPY may continue to track the swings in longer-dated US Treasury yields even though the FOMC stays on track to “increase our holdings of Treasury securities by at least $80 billion per month and of agency mortgage-backed securities by at least $40 billion per month,” but the recent flip in retail sentiment may coincide with a further appreciation in the exchange rate like the behavior seen earlier this year.
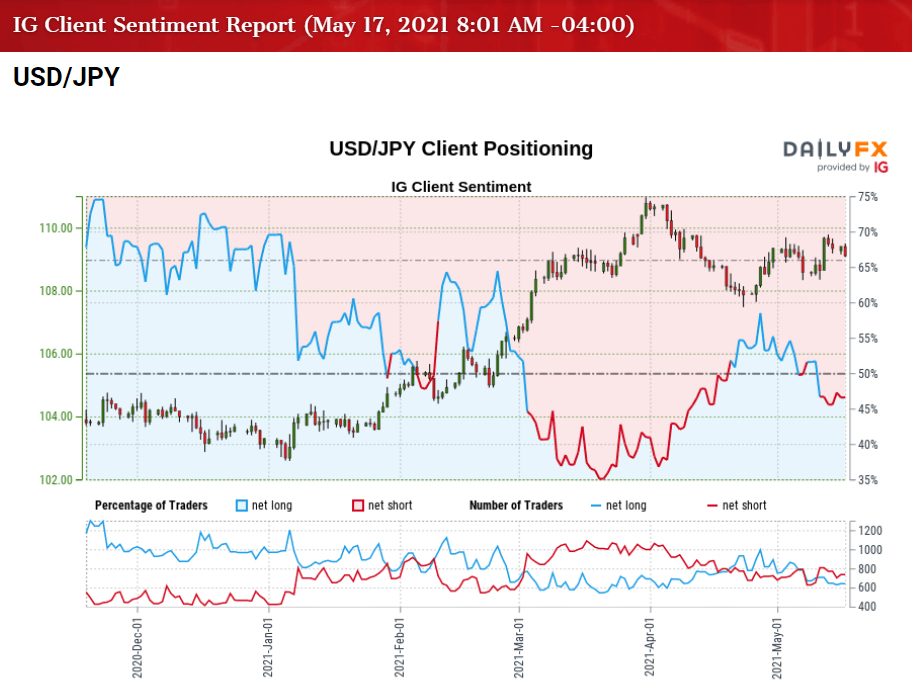
The IG Client Sentiment report shows 47.47% of traders are currently net-long USD/JPY, with the ratio of traders short to long standing at 1.11 to 1.
The number of traders net-long is 6.77% higher than yesterday and 2.25% lower from last week, while the number of traders net-short is 2.81% higher than yesterday and 0.90% lower from last week. The decline in net-long position comes as USD/JPY extends the series of lower highs and lows from last week, while the marginal drop in net-short position has led to an small change in retail sentiment as 47.12% of traders were net-long the pair last week.
With that said, the decline from the March high (110.97) may turn out to be a correction rather than a change in trend if the recent flip in retail sentiment mimics the crowding behavior from earlier this year, but the exchange rate may continue to trade within the confines of the April range even as the move above the left shoulder largely removes the threat of a head-and-shoulders formation.

USD/JPY Rate Daily Chart
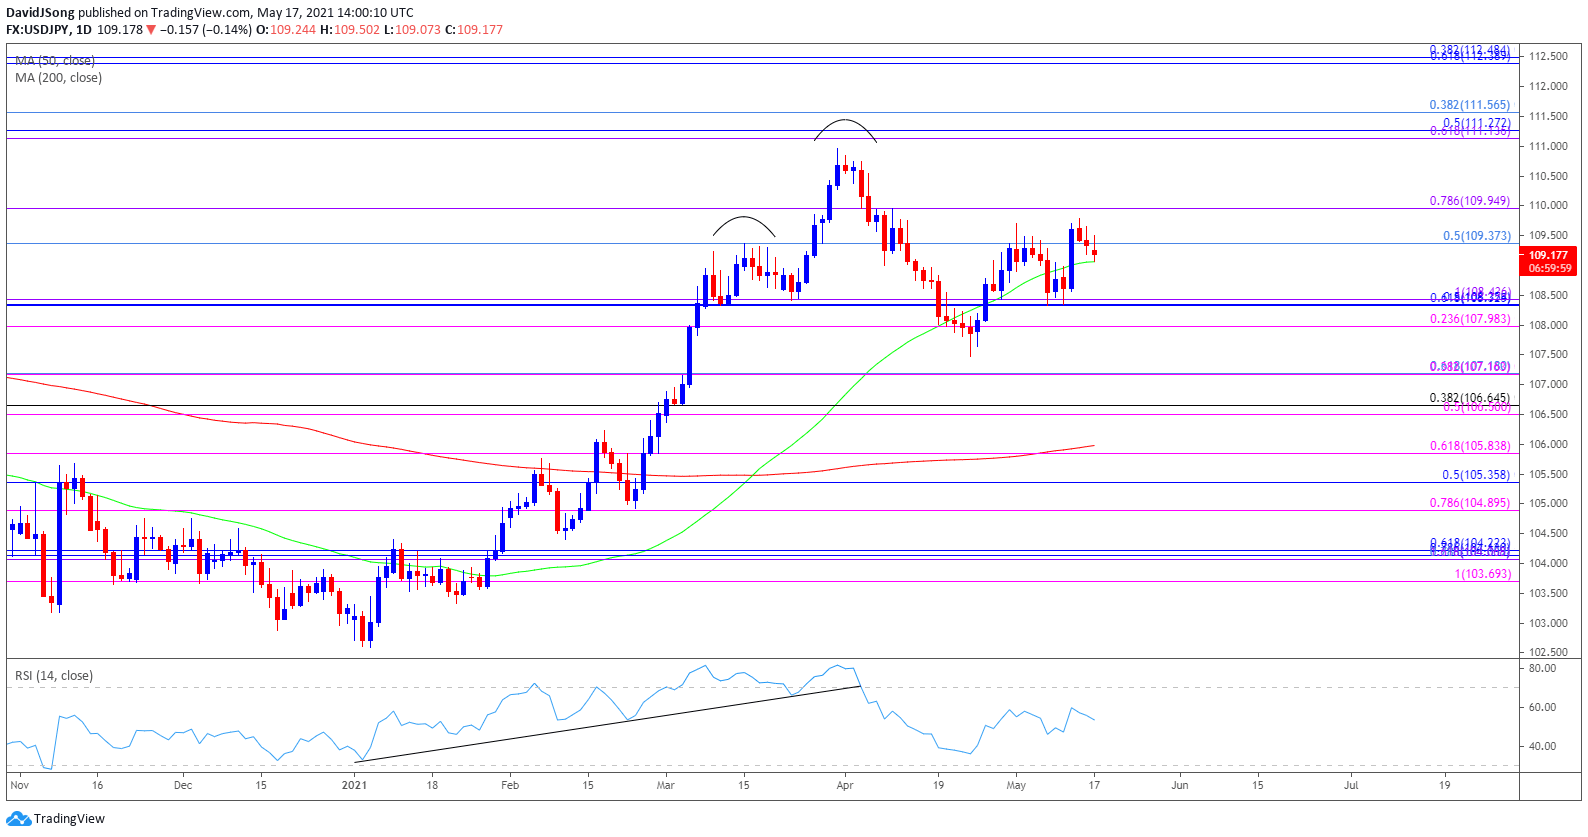
Source: Trading View
- USD/JPY approached pre-pandemic levels as a ‘golden cross’ materialized in March, with a bull flag formation unfolding during the same period as the exchange rate traded to a fresh yearly high (110.97).
- The Relative Strength Index (RSI) showed a similar dynamic as the indicator climbed above 70 for the first time since February 2020, but the pullback from overbought territory has negated the upward trend from this year, with USD/JPY dipping below the 50-Day SMA (109.06) for the first time since January.
- Nevertheless, USD/JPY appears to have reversed course ahead of the March low (106.37) in an attempt to remove the threat of a head-and shoulders formation, with the exchange rate breaking above the left shoulder in May.
- However, USD/CAD carves a series of lower highs and lows following the failed attempts to break/close above the Fibonacci overlap around 109.40 (50% retracement) to 110.00 (78.6% expansion), with a move below the 50-Day SMA (109.06) bringing the 108.00 (23.6% expansion) to 108.40 (100% expansion) area on the radar.
- Need a close above the Fibonacci overlap around 109.40 (50% retracement) to 110.00 (78.6% expansion) to open up the March high (110.97), with the next area of interest coming in around 111.10 (61.8% expansion) to 111.60 (38.2% retracement).

--- Written by David Song, Currency Strategist
Follow me on Twitter at @DavidJSong


