


Technical Forecast for Crude Oil: Neutral
- Crude oil prices rebounded sharply mid-week, gaining nearly +5% as it became clear that Democrat Joe Biden would win the presidency. However, a divided Congress tempered gains.
- The supply-demand deficit continues to be the predominant driver of energy markets, with price action constrained by coronavirus pandemic fears.
- The IG Client Sentiment Index suggests that crude oil prices have a mixed outlook.
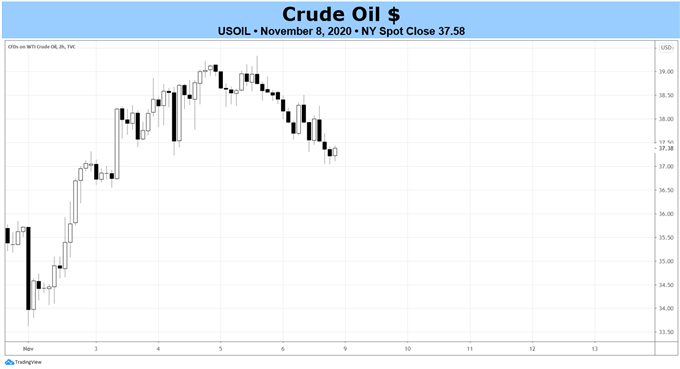
Crude Oil Prices Week in Review
The first week of November proved to be the best weekly performance since the first week of October for crude oil prices, with the black gold adding +4.65% following a drop of -10% in the week prior. Largely driven by risk-on/risk-off trends surrounding COVID-19 outbreak headlines and news around the US presidential election, crude oil prices have experienced more volatility in recent weeks than what was experienced during the summer months. The daily 21-EMA (one month of trading) for OVX, the crude oil volatility ETF, is now at 53.48, its highest level since July 20. But more volatility doesn’t necessarily equate to direction in the current market environment; indeed, crude oil prices continue to move sideways.
Economic Calendar Week Ahead Impact on Crude Oil Prices
The economic calendar in the week ahead caters little to significant volatility in crude oil prices. While the Reserve Bank of New Zealand interest rate decision may bring further development towards implementation of negative interest rates, the RBNZ is not a significant enough player to decisively move energy markets (the way, say, the Fed, ECB, or PBOC could). GDP data from the UK and the Eurozone will be monitored, but these are not the initial iterations of the growth reports, so the data are effectively priced-in.
It still holds that, given the changing nature of energy production and demand as the global economy grapples with overcoming the coronavirus pandemic, we’ll want to keep on the EIA inventory data due to be released at 15:30 GMT on Wednesday, November 11. The data will continue to support our thesis that we’re in the beginning innings of a long ballgame where there will be persistent supply-demand deficits – for the next several quarters, if not years.

Crude Oil Price Chart – Weekly Timeframe (November 2015 to November 2020) (Chart 1)
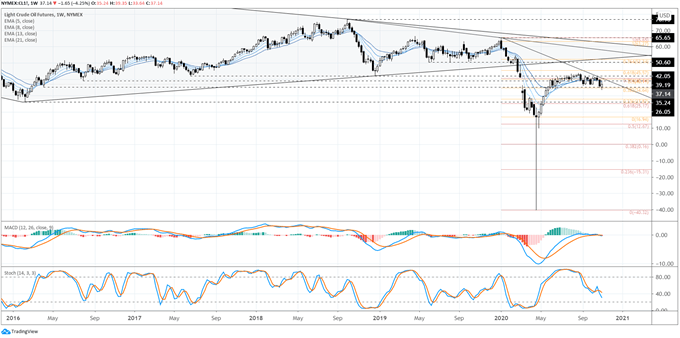
The weekly chart of crude oil prices shows that following an impressive recovery from the coronavirus pandemic lows from March through June, crude oil prices have not been able to make any significant progress. The losses around the coronavirus pandemic saw the 11-year symmetrical triangle yield a downside breakout, but the recovery has stalled as crude oil prices have traded sideways for several months. While some downside momentum is emerging, that weekly MACD is flat at its signal line speaks to the set-in indecision of the market.
Crude Oil Price Chart – Daily Timeframe (April 2019 to November 2020) (Chart 2)
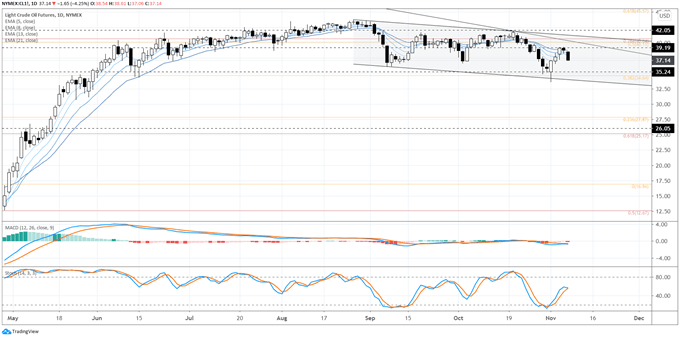
A closer look at the daily timeframe highlights the rangebound price action of crude oil in recent months. A slight descending channel may be in place going back to the late-August high and mid-October highs, with support coming into play with the daily bullish key reversal on October 30. The jump at the start of November has helped neutralize nascent bearish momentum on short-term timeframes. Daily MACD remains ever so slightly below its signal line and trending lower, but Slow Stochastics are in bullish territory, having advanced through the median line last week. The difference between the daily 5-EMA and the daily 21-EMA remains less than 2%, further evidence that momentum is lacking.
IG Client Sentiment Index: Crude Oil (November 9, 2020) (Chart 3)
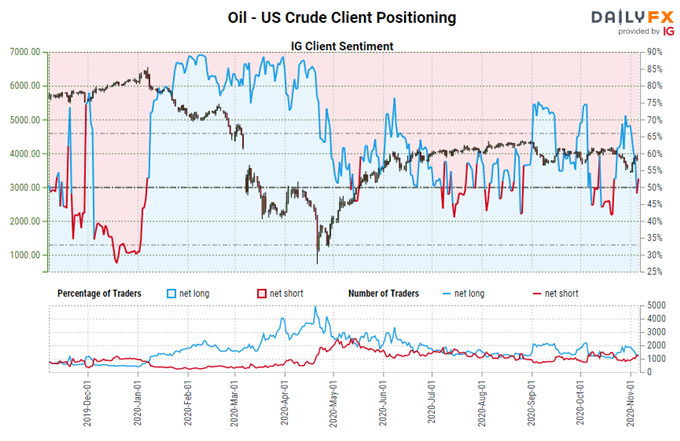
Oil - US Crude: Retail trader data shows 60.99% of traders are net-long with the ratio of traders long to short at 1.56 to 1. The number of traders net-long is 12.55% higher than yesterday and 19.02% lower from last week, while the number of traders net-short is 18.72% lower than yesterday and 10.68% higher from last week.
We typically take a contrarian view to crowd sentiment, and the fact traders are net-long suggests Oil - US Crude prices may continue to fall.
Positioning is more net-long than yesterday but less net-long from last week. The combination of current sentiment and recent changes gives us a further mixed Oil - US Crude trading bias.

Latest COT Data Shows Oil Longs Ease
Finally, looking at positioning, according to the CFTC’s COT for the week ended November 3, speculators decreased their net-long Crude Oil positions to 442.5K contracts, slightly down from the 472.1K net-long contracts held in the week prior. Crude oil net-long positioning has been slowly eroding over the past three months. Crude oil net-long positioning remains far below the highs seen over the past two and a half years, when 739.1K net-longs were held during the week ending February 6, 2018.

--- Written by Christopher Vecchio, CFA, Senior Currency Strategist


