


GOLD, XAU/USD, US DOLLAR (DXY), REAL YIELDS, FED - Talking Points
- Gold has slipped down the elevator shaft as commodities sink
- Real yields have continued higher, boosting the US Dollar
- Fed rate rise is all set for later today. Will a hike help XAU/USD?

Gold has done a screeching u-turn after approaching a record high last week. The entire commodity complex has seen wild swings in price as the threat of war undermines supply lines and post-pandemic recoveries.
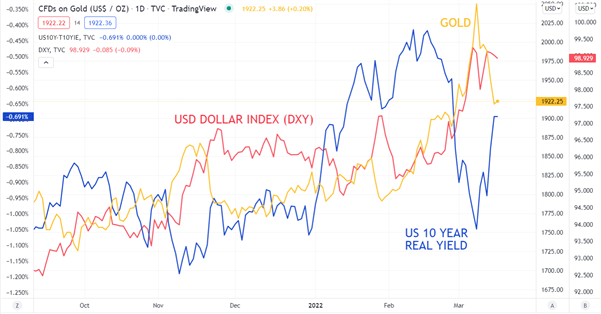
While the broader commodity price action has played a role in the demise of the precious metal, rising real yields are also working against it. The US 10-year real yield has risen 45 basis-points since last week’s low.
Over this period, market priced inflation has seen small variations, but nominal Treasury yields has been doing the heavy lifting, rising 48 basis points for the 10-year tenure. The 10-year note is currently yielding around 2.15%.
The entire Treasury curve has been increasing their rates of return ahead of today’s Federal Reserve meeting. A 25 basis-point hike is baked in for rates lift off and this has helped to boost the US Dollar.
The US Dollar, as represented by the DXY Index, is currently hovering near levels not seen since May 2020.
The DXY index is a US Dollar index that is weighted against EUR (57.6%), JPY (13.6%), GBP (11.9%), CAD (9.1%), SEK (4.2%) and CHF (3.6%).
The haven status of the US Dollar has also contributed to its strengthening as the Ukraine war unfolds. In times of uncertainty the Japanese Yen and the Swiss Franc typically see inflows as well, however, the US Dollar has outperformed these fellow haven currencies.
If the Fed sticks to its plan later today, it may not have much impact as it has been very well telegraphed. Any variation from a 25 bp hike could see further volatility.
GOLD, US DOLLAR (DXY) AND US 10-YEAR REAL YIELD
Introduction to Technical Analysis
Moving Averages
Recommended by Daniel McCarthy
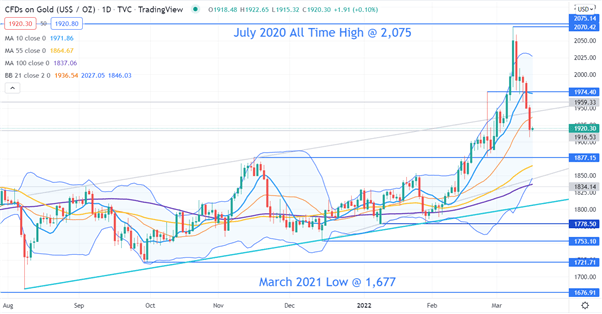
GOLD TECHNICAL ANALYSIS
Unable to overcome the all-time high at 2,075, the market rejected the gold rally.
A close back inside the 21-day simple moving average (SMA) based Bollinger Band saw further moves south.
Crossing below the 10 and 21-day SMAs confirmed the withdrawing of bullish momentum
Support on the downside could be at the pivot point of 1877.15 or the 55 and 100-day SMAs, currently at 1864.67 and 1837.06 respectively. Below that, an ascending trend line may provide support just above 1800.
On the topside, resistance might be at the pivot point of 1974.40 or the previous peaks of 2070.42 and 2075.14
--- Written by Daniel McCarthy, Strategist for DailyFX.com
To contact Daniel, use the comments section below or @DanMcCathyFX on Twitter


