


Crude Oil, US Dollar, Nord Stream 2, WTI, EIA/DOE - Talking Points
- Crude oil prices maintain lofty levels as various factors support it
- Supply issues in the Middle East are making the market fret
- Energy demand in Europe looms as winter approaches. Will WTI rise?

Crude oil has pulled back from a 7-year high today after a series of events that saw a scramble for the vital energy commodity. The WTI futures contract traded at $86.79 bbl.
Middle East tensions rose after a drone attack on the United Arab Emirates capital kicked off the squeeze earlier in the week. It was orchestrated by the north Yemen-based Houthi rebels that are backed by Iran.
Then Goldman Sachs released a bullish report. They are predicting USD 105 a barrel in 2023, citing limited spare capacity.
Finally, an explosion of a pipeline connecting the northern Iraqi oil fields to the Turkish port of Ceyhan saw the black gold run to new heights. The port mainly services tankers headed to Europe.
Once that pipeline was repaired, the market frenzy calmed somewhat, and the price has since retreated lower.
In the background, other energy commodity prices continue to trade at elevated levels in Europe due to the tension between Russia and the EU. The certification of the Nord Stream 2 natural gas pipeline from Russia to Germany is unlikely until the second half of this year at the earliest.
Option markets may have a role to play should crude rally above $90 bbl. According to data from Bloomberg, very few puts (the right but not the obligation to sell at a strike price on a specified date) have been written with strikes above $90 bbl.
However, there is a significant number of calls (the right but not the obligation to buy at a strike price on a specified date) that have been written with strikes above $90 bbl and all the way up to $150 bbl.
This implies that as the price of oil goes above $90 bbl, the option price makers (the sellers of the options) will need to buy oil in order to hedge their exposure. This is known as delta hedging.
Of course, once the price has moved up through various thresholds and the options have been hedged, if the price is to fall, then delta hedging will see those same buyers turn around and start selling. This could lead to a higher volatility environment.
The weekly EIA/DOE crude oil status reports are due out in the up-coming North American session.

Crude Oil Technical Analysis
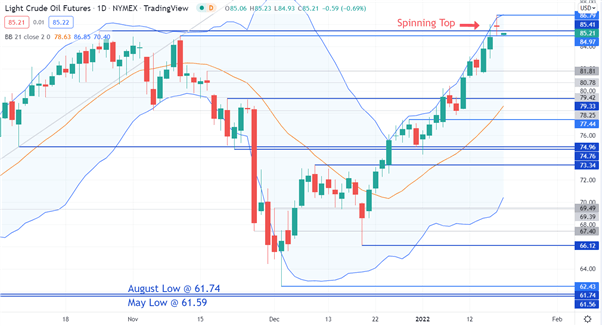
WTI crude oil traded at its highest level since October 2014 yesterday.
However, after the close, a bearish spinning top candlestick can be observed. The formation indicates uncertainty, and it could signal that a reversal in price might occur.
The move up has nudged against the 21-day simple moving average (SMA) based Bollinger Band but it has been unable to close outside the upper band. This could indicate that the market is comfortable with the rate of change in the rally.
On the topside, resistance may be offered at the previous high and pivot point of 86.79 and 85.41 respectively.
While on the downside, support is potentially at the pivot points and previous lows of 84.97, 79.33, 77.44, 74.96, 74.76 and 73.34.
--- Written by Daniel McCarthy, Strategist for DailyFX.com
To contact Daniel, use the comments section below or @DanMcCathyFX on Twitter


