


US Recession Watch Overview:
- There is less than a 25% chance of a recession hitting the United States within the next 12-months, according to the NY Fed Recession Probability Indicator.The 3m10s spread is currently 31.7-bps; onthe last day of November it was 22.1-bps.
- Risk appetite remains firm as the twisting US Treasury yield curve signals a relaxation in US recession fears.
- As US recession odds fade, traders have pushed back the timing of the next Fed rate cut to July 2020.
See the DailyFX Economic Calendar and see what live coverage for key event risk impacting FX markets is scheduled for next week on the DailyFX Webinar Calendar.
US Recession Fears Fade Ahead of December Fed Meeting
In the prior entry in the US Recession Watch series, we concluded that “a look at price action over recent weeks suggests that many of the concerns from the summer months have evaporated.
“With a potential US-China trade deal appeared on the horizon, traders were keen to jettison safe haven assets like the Japanese Yen and US Treasuries (pushing yields higher – more on that below) and bid up higher risk assets like equities.”
This trend continued in November and there are few signs that recession fears will rise again in the near-term. It would seem that only a deflation of the US-China trade war Phase 1 talks would prove to be a catalyst for a rebound in recession fears.
Read more: China Makes a Bet Against the US Dollar as World Reserve Currency
US Economic Data Improves, Lifting Q4’19 US GDP Forecasts
Over the course of November, US economic data improved relative to analysts’ expectations. The Citi Economic Surprise Index for the US improved from 4.7 at the end of October to 13.1 by the end of November. Given that data outperformed and growth expectations rebounded suggests that fears of a US and a global recession are continuing to fade – as was noted in the November US recession watch update.
Atlanta Fed GDPNow Q4’19 US GDP Estimate (December 10, 2019) (Chart 1)
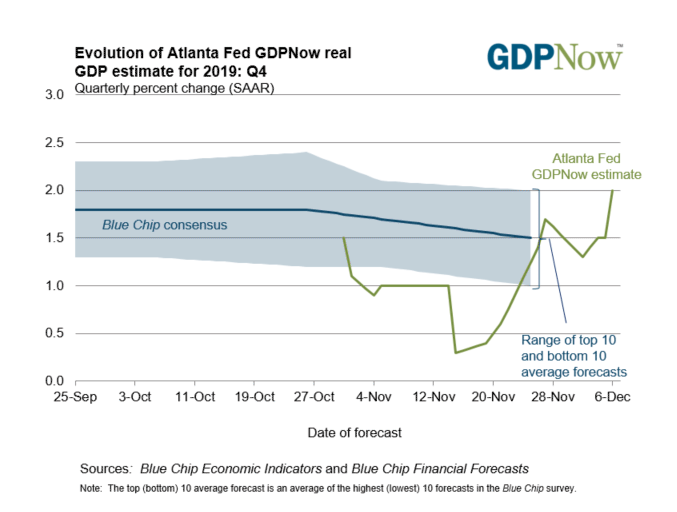
With US economic data momentum improving, US growth expectations have perked up in recent weeks. Based on the data received thus far about Q4’19, the Atlanta Fed GDPNow forecast is looking for growth at 2%. Q4’19 US GDP expectations have ranged between 0.3-2.0% since tracking began at the end of October. The next update to the Q4’19 forecast will be released after the November US retail sales data on December 13.
Fed Rate Cut Expectations Remain Depressed
According to Fed funds futures, there is now a 0% chance of either a 25-bps rate hike or rate cut at the December Fed meeting; one week ago, there was a 5% of a 25-bps rate hike and a 95% chance of no change in interest rates.
Federal Reserve Interest Rate Expectations (December 10, 2019) (Table 1)
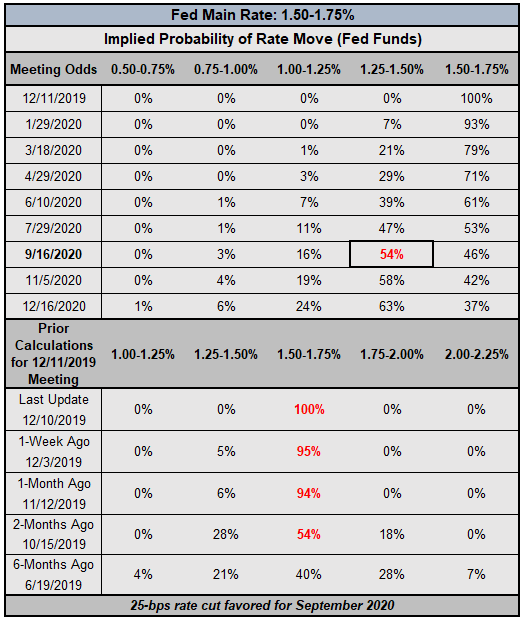
According to Fed funds futures, the timing of the next interest rate cut remains depressed as it has been since early-November. Last week, rates markets have been discounting July 2020 as the most likely period for the next Fed rate cut; now, September 2020 is favored (54% implied probability).
Even as Fed interest rate cut odds have remained depressed – and US Treasury yields have edged higher – the US Dollar (via the DXY Index) has continued to struggle in December, still down versus every major currency month-to-date.
Read more: Gold Price Forecast: Downtrend Remains Ahead of December Fed Meeting - Key Levels for XAU/USD
Using the US Yield Curve Inversion to Predict Recessions
The US Treasury yield curve continues to twist and steepen. Long-end yields are pusing higher relative to where they were one-week ago, but short-end yields have fallen.
The relatively faster rise by long-end yields compared to short-end yields may be seen as a sign that market participants don’t believe that the US will fall into recession soon; long-end yields are viewed as a proxy for growth and inflation expectations.
This twisting US yield curve is not quite giving a raving assessment of US growth prospects, though; indeed, the Atlanta Fed Q4’19 GDPNow US growth forecast has just moved back to 2%.
US Treasury Yield Curve: 1-month to 30-years (December 10, 2019) (Chart 2)
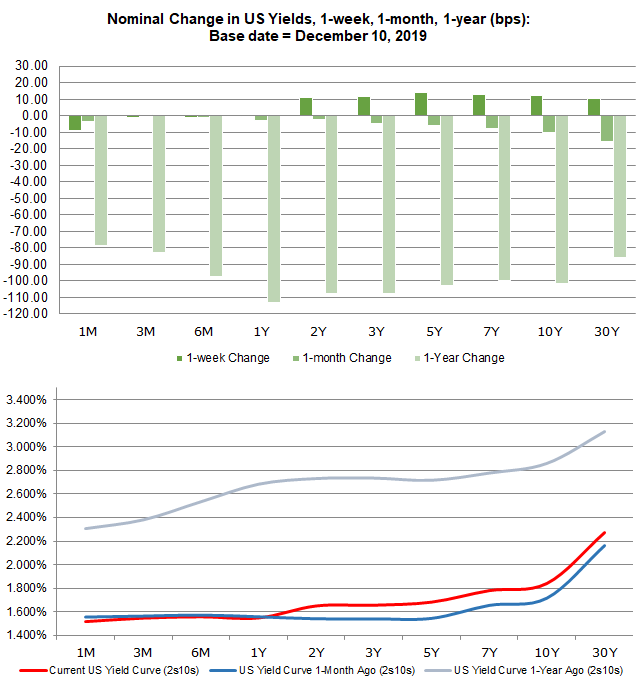
The twisting of the US Treasury yield curve – short-end yields are falling while long-end yields are rising – has proven to be a positive development for risk appetite. As the US Treasury yield curve steepened last month (the 3m10s spread moved from 22.1-bps to 29.6-bps in November), the US S&P 500 gained 3.47%.
A Refresher: Why Does the US Yield Curve Inversion Matter?
Market participants use yield curves to gauge the relationship between risk and time for debt at various maturities. Yield curves can be constructed using any debt, be it AA-rated corporate bonds, German Bunds, or US Treasuries.
A “normal” yield curve is one in which shorter-term debt instruments have a lower yield than longer-term debt instruments. Why though? Put simply, it’s more difficult to predict events the further out into the future you go; investors need to be compenstated for this additional risk with higher yields. This relationship produces a positive sloping yield curve.
When looking at a government bond yield curve (like Bunds or Treasuries), various assessments about the state of the economy can be made at any point in time. Are short-end rates rising rapidly? This could mean that the Fed is signaling a rate hike is coming soon. Or, that there are funding concerns for the federal government. Have long-end rates dropped sharply? This could mean that growth expectations are falling. Or, it could mean that sovereign credit risk is receding. Context obviously matters.
US Treasury Yield Curves: 3m10s and 2s10s (1975 to 2019) (Chart 3)
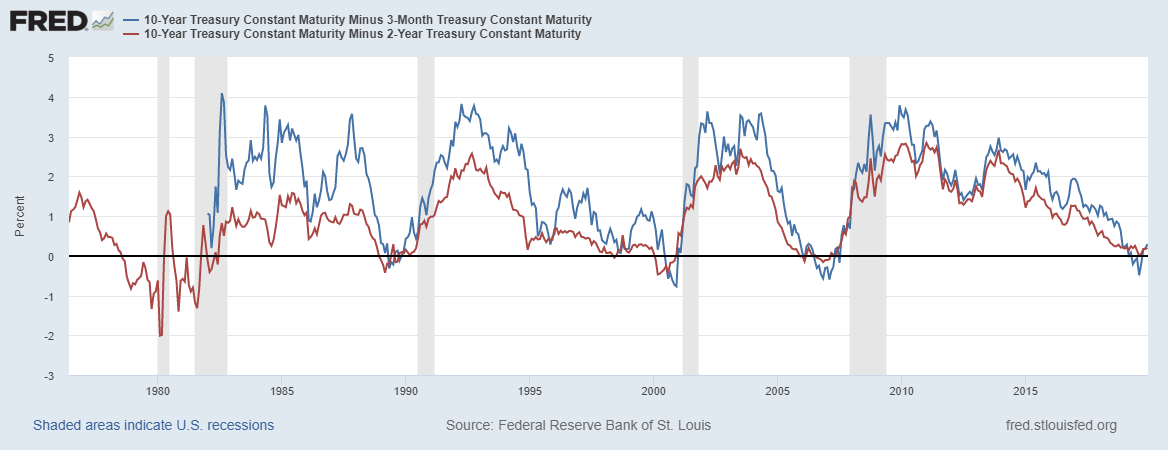
There is an academic basis for yield curve analysis. In 1986, Duke University finance professor Campbell Harvey wrote his dissertation exploring the concept of using the yield curve to forecast recessions. Professor Campbell’s research noted that the US yield curve needs to invert in the 3m10s for at least one full quarter (or three months) in order to give a true predictive signal (since the 1960s, a full quarter of inversion has predicted every recession correctly).
NY Fed Recession Probability Indicator (December 10, 2019) (Chart 4)
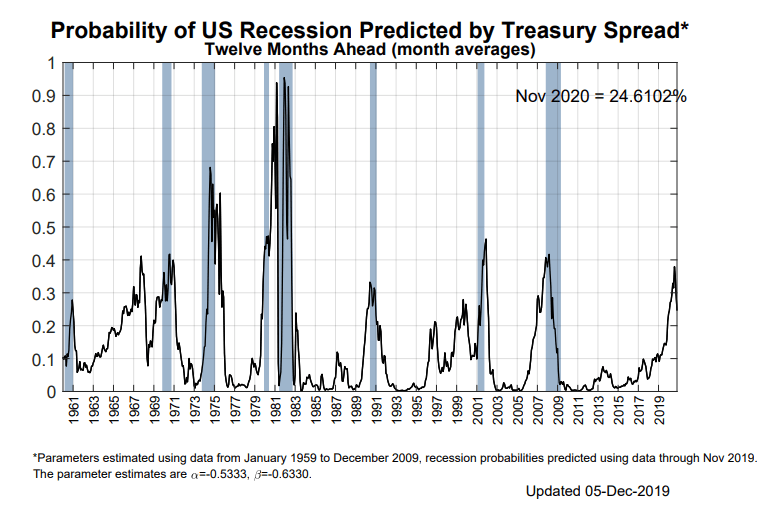
To this end, the signal for a US recession is fading: the 3m10s spread moved out of inversion territory in October and has remained in positive territory ever since. Using the 3m10s spread, the NY Fed Recession Probability Indicator is now suggesting a 25% chance of a recession hitting the US economy within the next 12-months – down from the 35% chance seen at the start of October.
Conclusions about US Yield Curve Inversion and US Recession Odds
The last time the NY Fed recession probability indicator was updated was on December 5. At that time, the 3m10s spread was 29.6-bps; onthe last day of November it was 22.1-bps; and on the last day of October it was 18-bps.Currently, the 3m10s spread remains in positive territory, trading at 31.7-bps.
The last time the 3m10s spread was at least 31.7-bps was during the first week of March 2019. Accordingly, backing out this assumption, the NY Fed Recession Probability Indicator would be discounting around a 15% chance of a recession hitting the US economy in the next 12-months if the indicator were updated in real-time. Traders should expect US recession concerns to continue to fade for the time being.
Read more: 75 Years Later, The Lessons of Bretton Woods Have Been Forgotten
FX TRADING RESOURCES
Whether you are a new or experienced trader, DailyFX has multiple resources available to help you: an indicator for monitoring trader sentiment; quarterly trading forecasts; analytical and educational webinars held daily; trading guides to help you improve trading performance, and even one for those who are new to FX trading.
--- Written by Christopher Vecchio, CFA, Senior Currency Strategist
To contact Christopher Vecchio, e-mail at cvecchio@dailyfx.com
Follow him on Twitter at @CVecchioFX
View our long-term forecasts with the DailyFX Trading Guides


