


US Dollar Price Analysis
- US Dollar price action has put in a stark change-of-pace over the past week.
- After a 3.7% gain in 2020 and a 2.7% gain through the first few weeks of February, DXY has given up 1.37% over the past week.
- Despite this recent momentum shift, the US Dollar is approaching a key zone of potential support. But will buyers show up to hold the lows?
US Dollar – Bears Pounce After Fresh Three-Year-Highs
It was a one-way show in the US Dollar through the first few weeks of February, and a similar statement can be made regarding the USD trend through 2020 trade. This came in stark contrast to the Q4 sell-off/bearish reversal as DXY price action fell through the bottom of a rising wedge formation.
But, after long-term Fibonacci support came in to help hold the lows through the New Year open; what started as a pullback soon turned into a fresh trend and US Dollar bulls continued to press through the first three weeks of February. This ran all the way up to the fresh three-year-high set last Thursday; but since then another stark change-of-pace has developed as the US Dollar has given back more than half of the February rally.
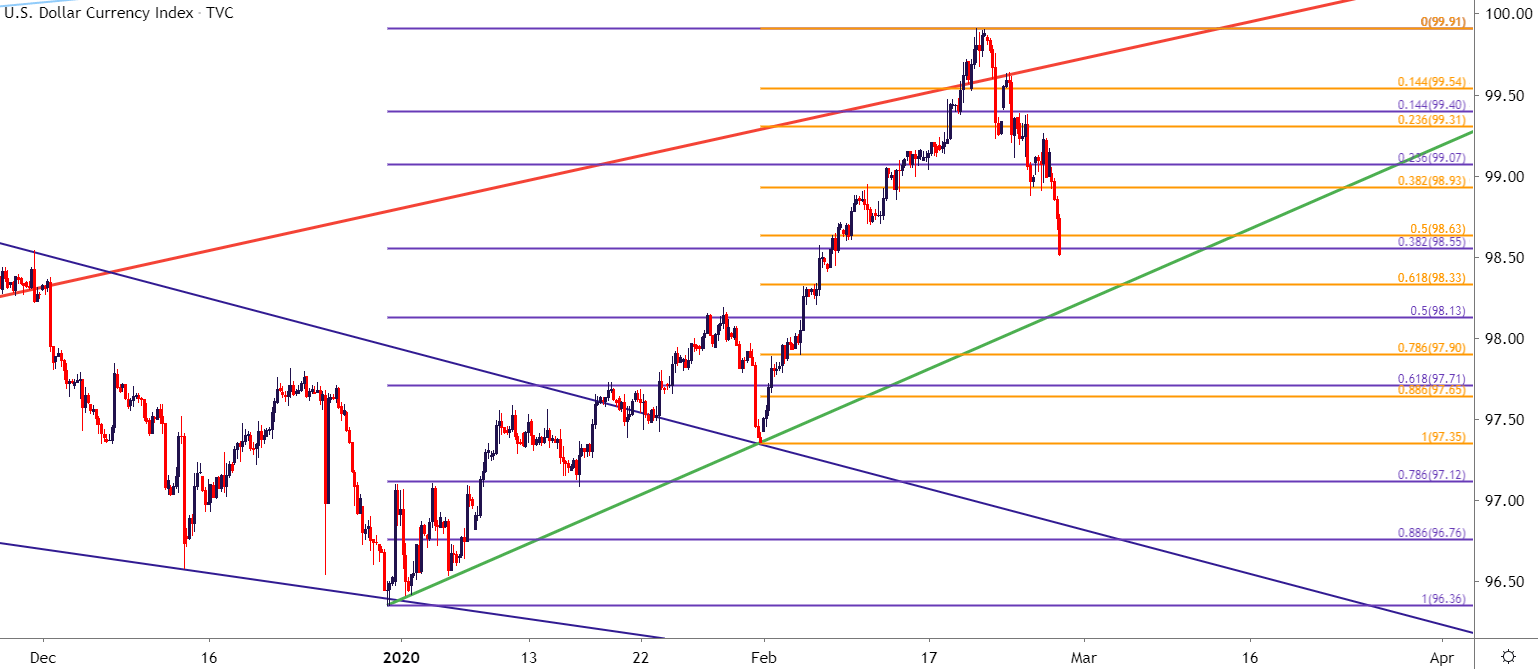
US Dollar Four-Hour Price Chart
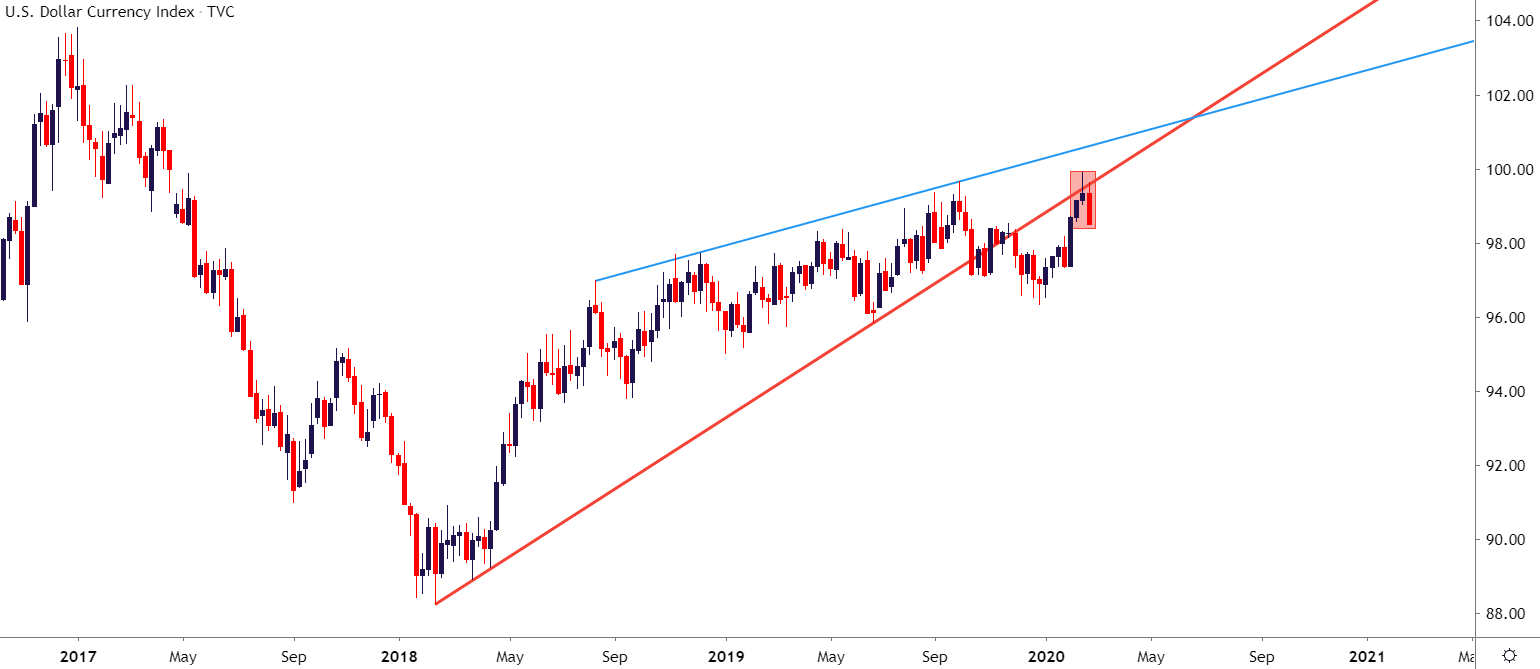
On a longer-term basis, a number of items remain of interest, key of which is a brewing evening star formation on the weekly chart. The current weekly bar is not yet completed so the formation isn’t yet set; but given the confluence of this potential formation with resistance taken from the underside of a bullish trend-line, there could be scope for further losses in the currency as the door opens into March.
US Dollar Weekly Price Chart
USD on Tradingview
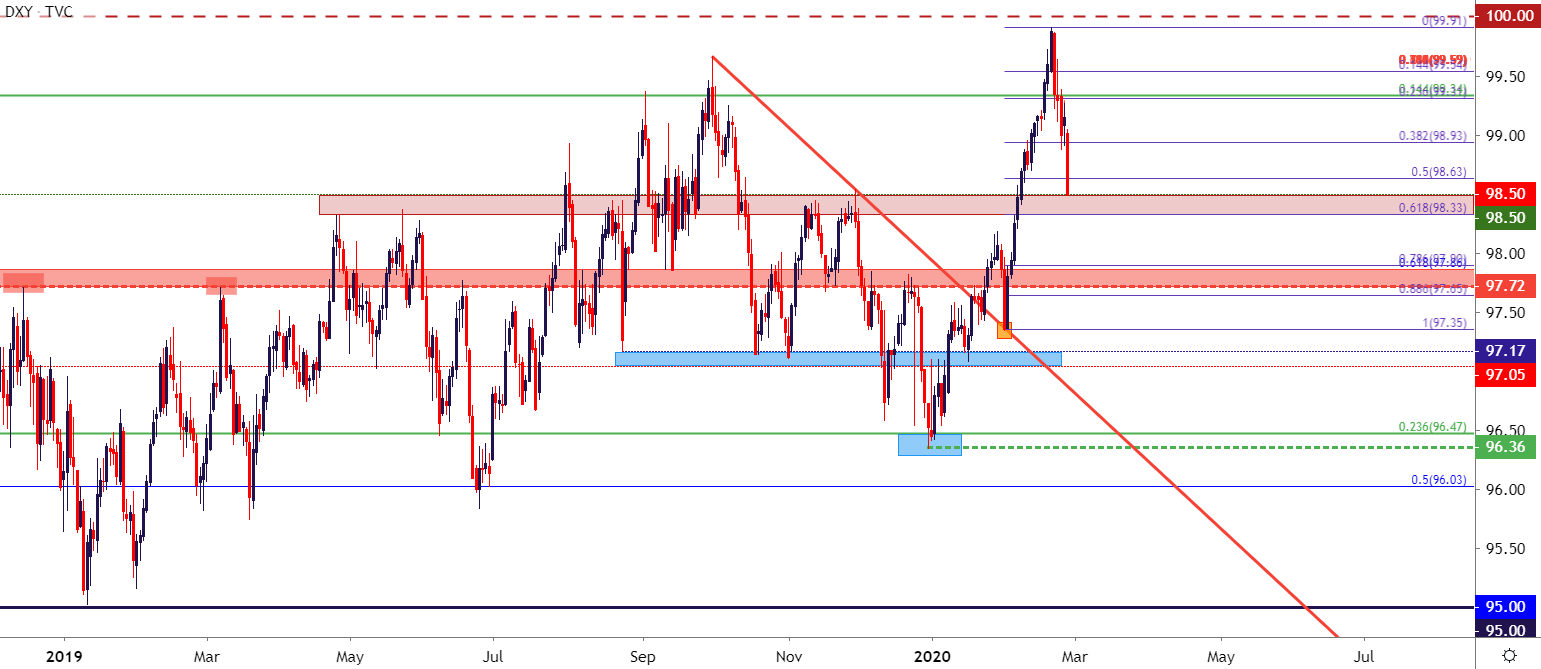
On a near-term basis, the US Dollar has already shredded through some key support areas; and lurking below are a couple of other areas of interest as taken from prior resistance swings. The zone that runs from 98.33-98.50 is of particular interest, and is very nearby current price action: This area helped to hold the highs in April and May of last year, coming back into play to hold resistance again through a couple of different tests in November before sellers posed the push down to fresh five-month-lows.

Another zone of interest sits just a little lower on the chart, plotted around the 97.70 level in DXY that had previously functioned as the yearly-high, holding buyers at bay through three separate tests in November and December of 2018, and again in March of 2019.
US Dollar Daily Price Chart
USD on Tradingview
--- Written by James Stanley, Strategist for DailyFX.com
Contact and follow James on Twitter: @JStanleyFX


