


Gold Price Talking Points:
- Gold prices have been in a one-sided trend over the past week, taking a trip from short-term resistance back down to a key zone of support.
- While the pullback/sell-off has now been going on for three full months, the longer-term backdrop remains bullish as this has only retraced 38.2% of that prior topside trend.
- DailyFX Forecasts are published on a variety of markets such as Gold, the US Dollar or the Euro and are available from the DailyFX Trading Guides page. If you’re looking to improve your trading approach, check out Traits of Successful Traders. And if you’re looking for an introductory primer to the Forex market, check out our New to FX Guide.
Gold Prices Grind at Support
Gold prices are closing in on their third full month of pullback following the blistering bullish trend from this summer. After Gold topped-out above the 1550 level in early-September, buyers have been held at bay as price action has digested those prior gains. And given the length of the pullback, now almost a full three months, it can be easy to forget about the topside momentum that was carrying prices higher earlier this year.
But at this stage, price action remains supported at a key area on the chart and the past three months have been but a 38.2% Fibonacci retracement of the summer breakout. This keeps the longer-term look at Gold prices as bullish, although timing remains of issue.
Gold Daily Price Chart
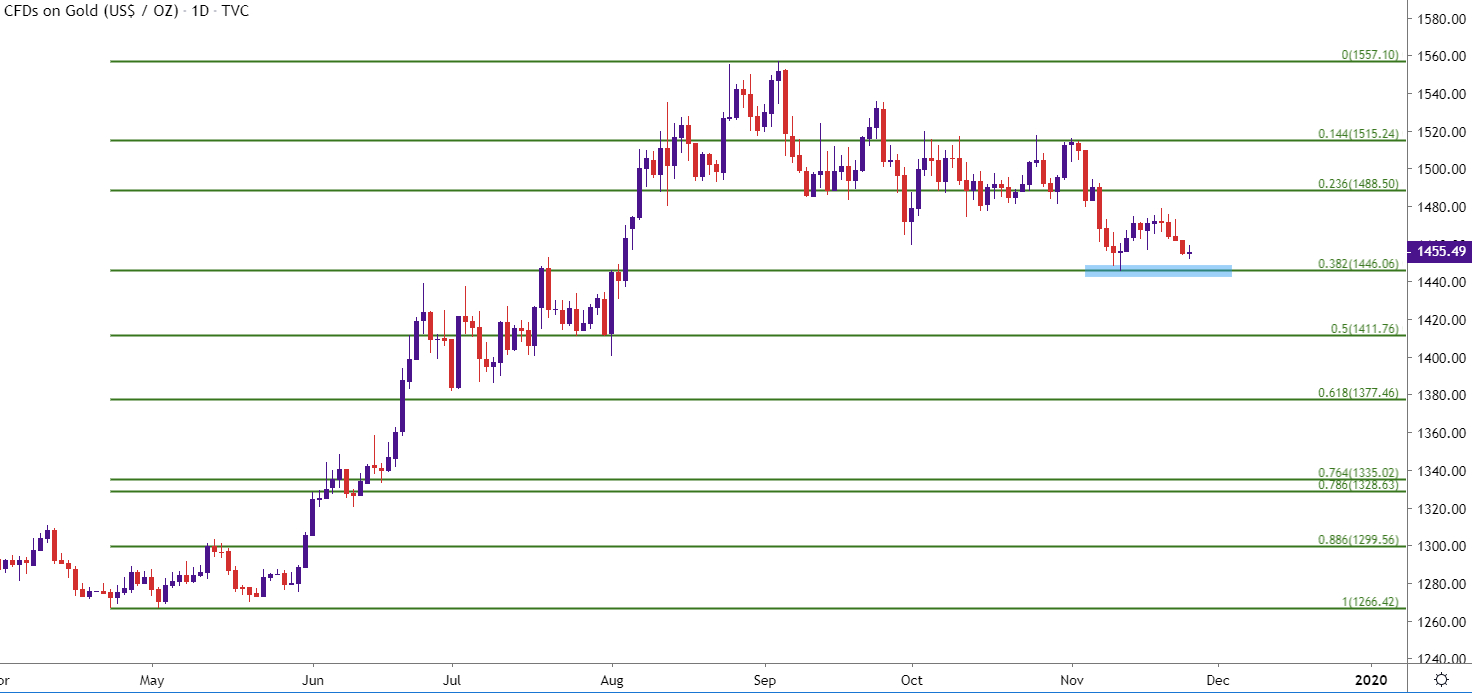
Chart prepared by James Stanley; Gold on Tradingview
Taking a step back and incorporating some longer-term technical items, and this current zone of support is something we’ve been looking at for a while in these pieces. This is around the secondary support zone looked at coming into this month, and that was derived from the July swing-high around 1453 to the October swing-low around 1460. This remains of interest as this is the area that’s currently helping to hold the lows, with the 38.2% retracement that caught the November swing lurking just underneath.
As looked at last Wednesday, Gold prices were finding resistance at a prior zone of support, keeping the door open for bearish strategies on an intermediate-term basis. The secondary target from that look has already come into play, and this is where buyers are coming back into the picture.
Gold Daily Price Chart

Chart prepared by James Stanley; Gold on Tradingview
Gold Price Strategy Moving Forward
Since that resistance inflection last week, sellers have been in firm control of short-term price action in Gold. Yesterday brought a test below 1453 and a quick bounce developed up to the prior October swing-low, with sellers making another appearance.
The complication with the short-side of the move at this point is one of proximity, as that three-month-low at the 38.2% Fibonacci retracement remains so near current price action and this could cap top-end profit targets for bearish plays; making short-side trend strategies as less attractive.
Gold Hourly Price Chart

Chart prepared by James Stanley; Gold on Tradingview
At this point, the primary item of attraction with Gold appears to be on the support side of the matter, watching to see if bulls can defend the November low, re-opening the door for bullish strategies in the yellow metal. If buyers are able to hold prices above yesterday’s swing low of 1451.50, the door could quickly re-open to bullish short-term reversals, which syncs with the longer-term bullish trend in Gold prices. Topside target potential exists around 1466, followed by a revisit to last week’s resistance at a prior support zone that runs from 1475-1480.
Gold Four-Hour Price Chart

Chart prepared by James Stanley; Gold on Tradingview
To read more:
Are you looking for longer-term analysis on the U.S. Dollar? Our DailyFX Forecasts have a section for each major currency, and we also offer a plethora of resources on Gold or USD-pairs such as EUR/USD, GBP/USD, USD/JPY, AUD/USD. Traders can also stay up with near-term positioning via our IG Client Sentiment Indicator.
Forex Trading Resources
DailyFX offers an abundance of tools, indicators and resources to help traders. For those looking for trading ideas, our IG Client Sentiment shows the positioning of retail traders with actual live trades and positions. Our trading guides bring our DailyFX Quarterly Forecasts and our Top Trading Opportunities; and our real-time news feed has intra-day interactions from the DailyFX team. And if you’re looking for real-time analysis, our DailyFX Webinars offer numerous sessions each week in which you can see how and why we’re looking at what we’re looking at.
If you’re looking for educational information, our New to FX guide is there to help new(er) traders while our Traits of Successful Traders research is built to help sharpen the skill set by focusing on risk and trade management.
--- Written by James Stanley, Strategist for DailyFX.com
Contact and follow James on Twitter: @JStanleyFX


