


Talking Points:
- Correlation Analysis Explained
- Strategy Webinar On Applying Strategy Analysis: Included
- Important Correlations In The Market Worth Watching
“Correlation doesn’t imply causation, but it does waggle its eyebrows suggestively and gesture furtively while mouthing ‘look over there.’”
Randall Munroe, Science & Math Cartoonist
Chances are when your family members are happy, so are you. This is a simple analogy to help show your emotions are positively correlated to your family’s emotions. Correlation analysis helps a trader to understand the strength of influence that one asset has another asset. Correlation coefficients are a standardized measure of covariance and are read from +1 to -1.
A correlation coefficient close to +1 such as +0.5 to +1.0 signifies a most significant positive correlation. Put in plain English, a move higher in one asset, which is often called the Independent or Explanatory asset with such a significant correlation coefficient would favor a move higher in the dependent or explained asset.
Want To Know What The Pros Learned From Trading In 2016, Check Out Our Top Lessons Here!
Correlation Coefficient of USD/JPY and the Japenese Equity Index, Nikkei 225
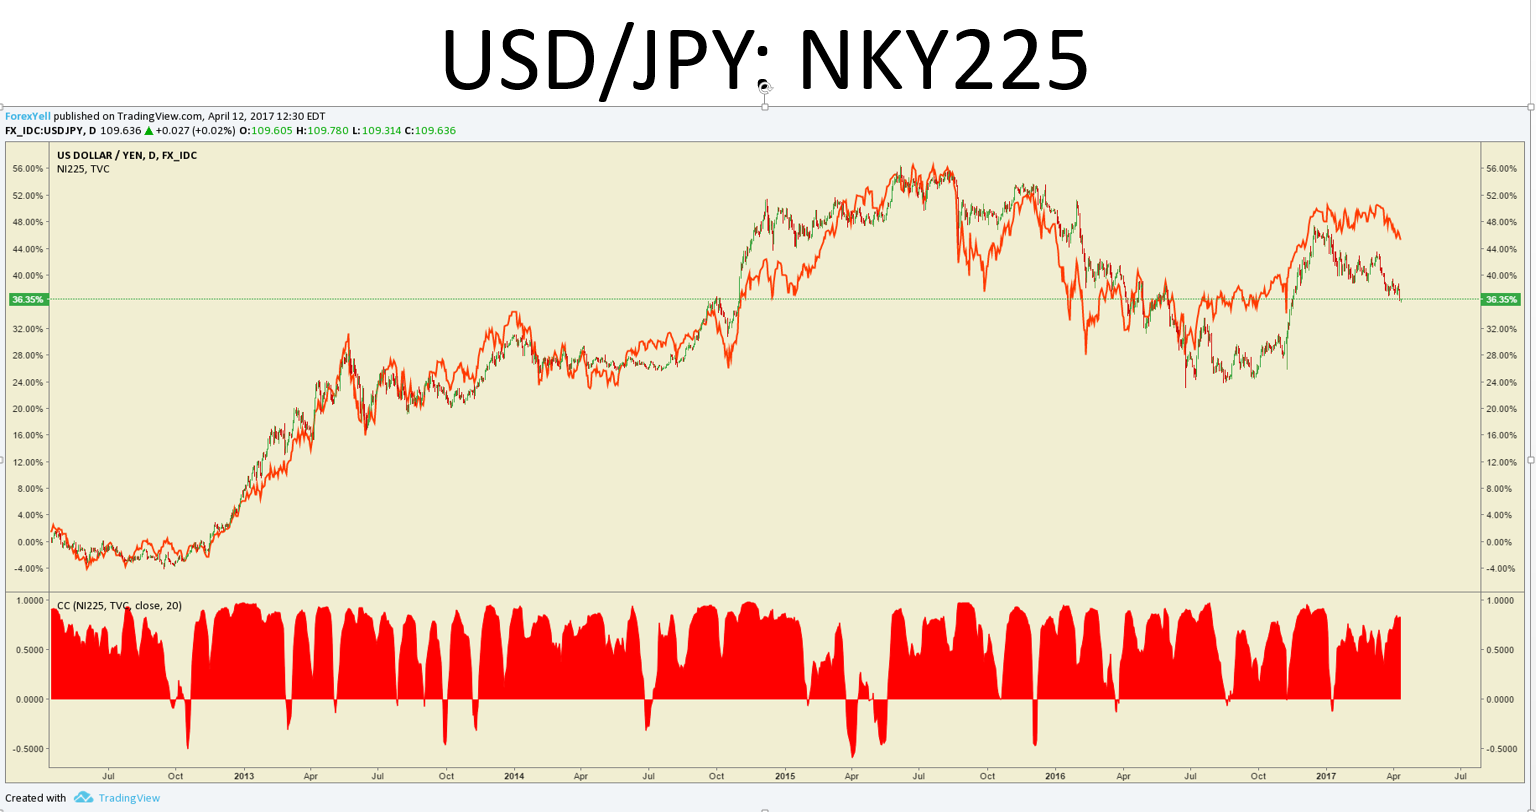
Chart Created by Tyler Yell
The inverse holds true with a significant negative correlation coefficient of -0.5 to -1.0. With a significant negative correlation, a move higher in an explanatory or independent asset would favor a move lower in the dependent or explained asset.
A common inverse correlation that traders keep an eye on is the price of USD/CAD and Crude Oil. A similar relationship can be seen with some emerging market currency pairs like USD/MXN and Crude Oil (CFD: USOil)
Correlation Coefficient of USD/JPY and the Japenese Equity Index, Nikkei 225
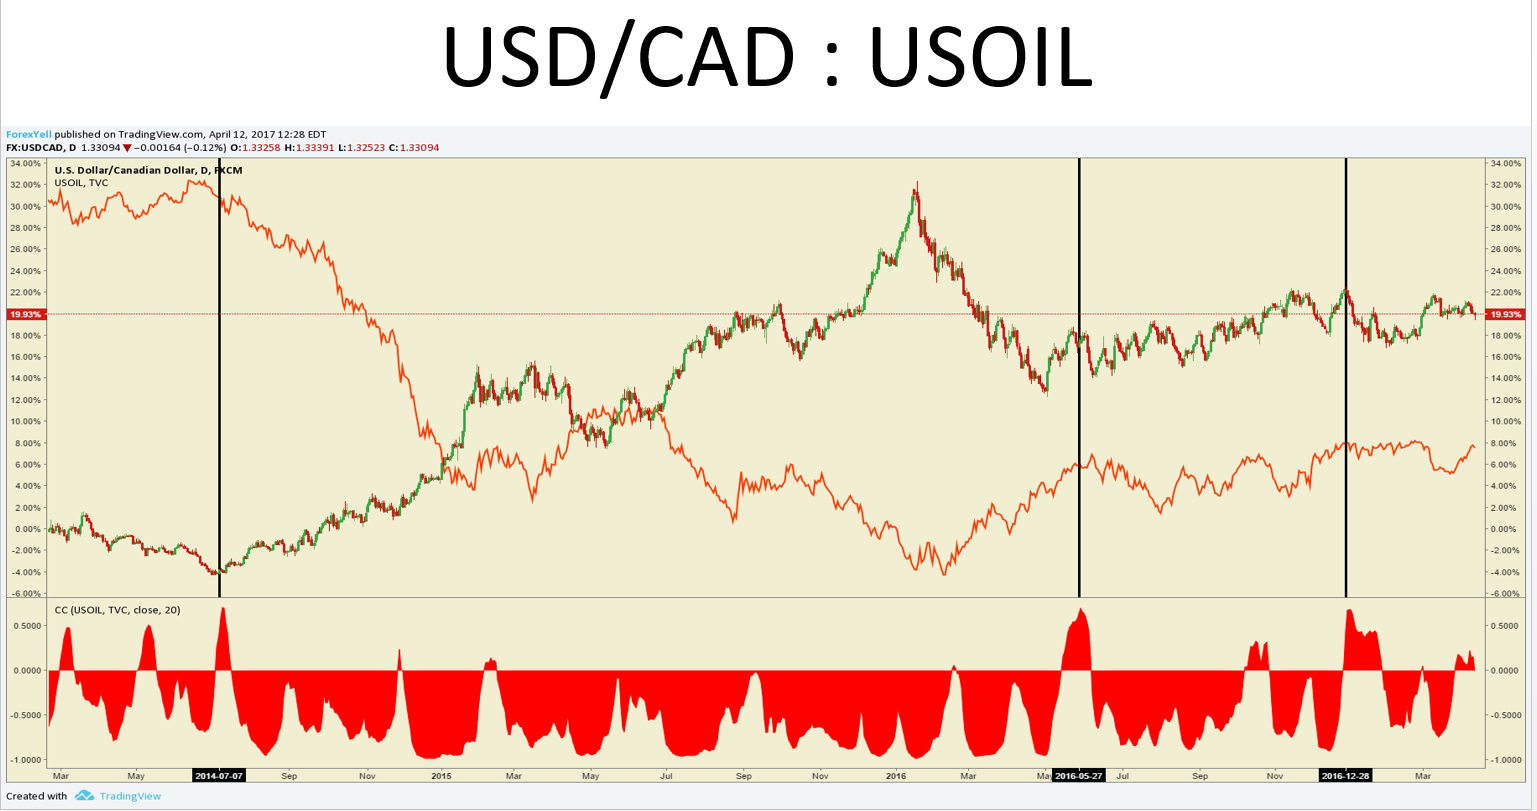
Chart Created by Tyler Yell
A word of warning:
Not all correlations are created equal. Quantitative-based traders often test the markets for correlations strengthening or weakening on a daily or weekly basis. It’s easy to fall victim to recency bias and think that because a correlation was present a few periods ago that they’ll be present again tomorrow. As you can see from both charts above, the correlations can break down, but often they will rejoin in the future if there is a strong reason for the positive or inverse correlation as I discuss in the webinar above.
As they say, all models are wrong, but some are useful. There are no Holy Grails, but correlation analysis can be a helpful tool to help you understand how the asset you like to trade is likely to move in the market.
For Extra-Juice In Your Trading, Try Combining Correlations With Sentiment Analysis
Happy Trading,
Tyler Yell, CMT


