


Talking Points
- Gold prices broke below $1311 negating the potential triangle
- Competing bullish and bearish patterns leave the outlook mixed in the short term
- Cluster of wave relationships and support appear at $1295-$1304; use this price zone to define the near term trend
On Monday, we highlighted the importance of $1311 in gold prices. On Tuesday, gold prices did break down below $1311, which negates the triangle pattern we were following.
We now have competing bullish and bearish patterns at play and the price behavior around $1295-$1304 will tip the hand as to which pattern we will favor.
As you can see in the chart below, we have a downward sloping orange price channel where gold prices are starting to pressure the lower bounds. Equal wave measurements of the 2 legs lower show up near $1301. Additionally, the May 2, 2016 high of $1304 shows up in the same area.
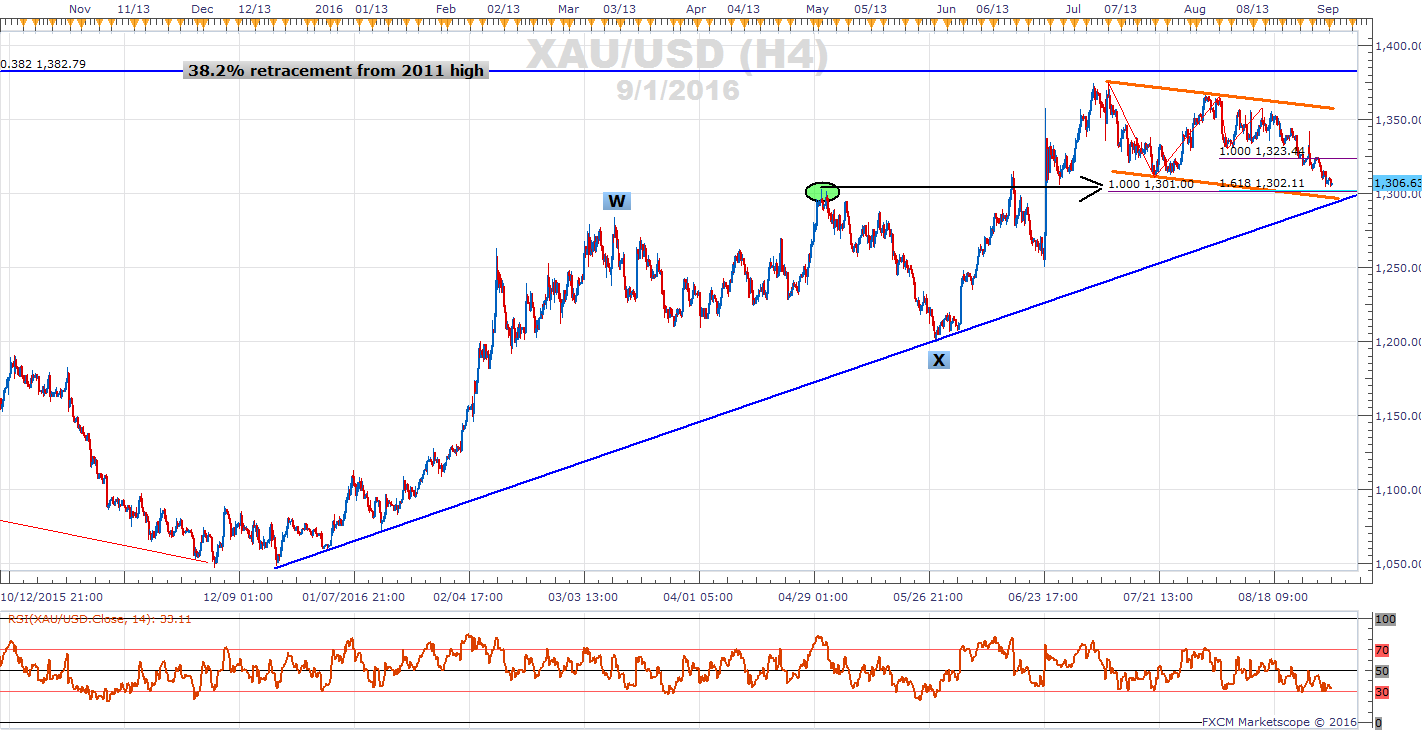
Chart prepared by Jeremy Wagner
Lastly, we have a blue upward sloping trend line, which has defined price action since December 2015. It crosses near $1295. Therefore, we have a bundle of wave relationships and support showing up in the $1295-$1304 price range. This is a hot spot where traders can position with a good chance of a good risk to reward ratio.
If prices hold above the blue trend line, then it suggests the uptrend is still in force and the door remains open to higher levels near $1375 and possibly $1435.
If the blue trend line breaks, then the break may indicate gold prices have topped. We will be keeping an eye out for impulsive declines to $1200.
Bottom line, the blue trend line provides a hot spot where something is about to give. Either gold prices are supported and continue higher or the 9 month trend is over.
This is a shorter term forecast for Gold. To read our quarterly and longer term forecast for Gold download our quarterly forecast here.
See gold trader positioning here.
Suggested Reading:
Gold Prices Drop and Fed Rate Hike Odds Rise
Dow Jones Industrial Average Awaits Friday’s Jobs Report
---Written by Jeremy Wagner, Head Trading Instructor, DailyFX EDU
Follow me on Twitter at @JWagnerFXTrader .
See Jeremy’s recent articles at his Bio Page.
To receive additional articles from Jeremy via email, join Jeremy’s distribution list.


