


Traders are often faced with dueling patterns on a potential trading opportunity. Sometimes, the patterns compete against one another as one will screams “bullish” and the other states “bearish.” This article will show you 2 competing patterns that are developing on the EURGBP and how to distinguish which pattern will likely ‘win.’
The two patterns discussed in this article are:
- Bullish – Inverse Head and Shoulders
- Bearish – Simple Trend Line Resistance
What’s interesting regarding this set up on the EURGBP is how both patterns reveal a significant pivot point near .8100. Let’s first review the make-up of each pattern.
Bullish – Inverse Head and Shoulders
The Inverse Head and Shoulders is a bottoming pattern that is the opposite of the Head and Shoulders. The more these 3 elements of a head and shoulders pattern that exists, the stronger I consider the pattern.
-Symmetry in the height of the shoulders
-Symmetry in the distance from the head to the left shoulder vs. the distance from the head to the right shoulder
-Fairly horizontal neckline
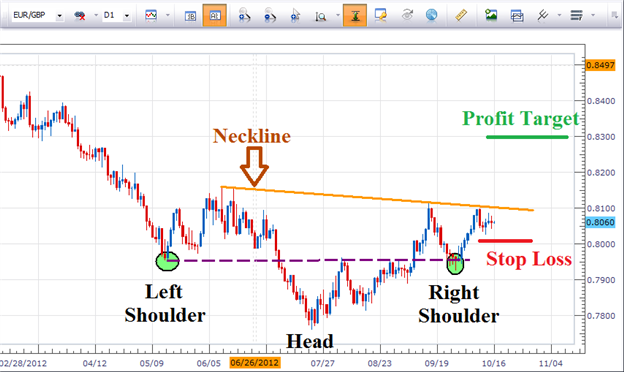
As you can see from the above picture, the purple dotted line represents (and green circles) the termination point of what would be the left shoulder and right shoulder. Notice how both shoulders terminated near the same price as the line is fairly horizontal.
Secondly, the distance from the left shoulder to the head is approximately 48 daily candles. Likewise, the distance from the head to the right should is approximately 48 candles.
Lastly, the orange line represents the neckline. Notice how this neckline is fairly horizontal and crosses today near .8100.
This pattern would offer a buying opportunity on a break above .8100. According to the chart above, place a stop loss just below the swing low near .8000. Look to take profits near .8300 for a 1:3 Risk-to-Reward Ratio.
Bearish – 15 Month Trend Line Resistance
The same chart also exposes a 15 month trend line dating back to July 2011. This trend line crosses near .8090 and prices are approaching this strategic pivot level. It takes 2 points to draw a trend line and the 3rd touch of the trend line offers the trading opportunity to sell.

Also, to strengthen this bearish picture, I had added Monthly Pivot levels, too. The green horizontal line represents the monthly R1 level and rests at .8087. Oftentimes, prices will find resistance at the monthly resistance levels. Use an oscillator like the Stochastic to time entries near the black resistance line.
A trader would wait for Stochastic to cross lower prior then enter the trade short. Place a stop loss just above the recent swing high or near .8125. Look to take profits at least twice the distance of your stop loss or near the next level of support. The monthly pivot point near .8000 will likely produce a bounce so be careful near this price level.
Which Pattern is Preferred?
It is entirely up to each individual trader which direction they wish to trade the pair. I would lean towards the bearish pattern for a couple of reasons:
- There is a confluence of resistance bound by the monthly R1, 15 month trend line, and inverse head and shoulder neckline. This is a lot of resistance for the pair to plow through for me to lose on the trade.
- The direction of the carry is in the bearish pattern. Said another way, even if this pair trades sideways, I can collect daily interest through the roll-over.

Above, we can see that a seller of the EURGBP actually earns a daily interest payment of 9 cents. It doesn’t sound like much, but you would get paid to hold the pair in the event prices move sideways after entry.
Best of luck with your trading!
---Written by Jeremy Wagner, Head Trading Instructor, DailyFX Education
To contact Jeremy, email jwagner@dailyfx.com. Follow me on Twitter at @JWagnerFXTrader.
To be added to Jeremy’s e-mail distribution list, click HERE and enter in your email information.
New to the FX market? Save hours in figuring out what FOREX trading is all about.
Take this free 20 minute “New to FX” course presented by DailyFX Education. In the course, you will learn about the basics of a FOREX transaction, what leverage is, and how to determine an appropriate amount of leverage for your trading.
Register HERE to start your FOREX learning now!


