Nick Cawley, Analyst, May 16, 2017
My Picks: Long USDCHF
Expertise: Fundamental/Technical Analysis
Average Time Frame of Trades: One week to several weeks.
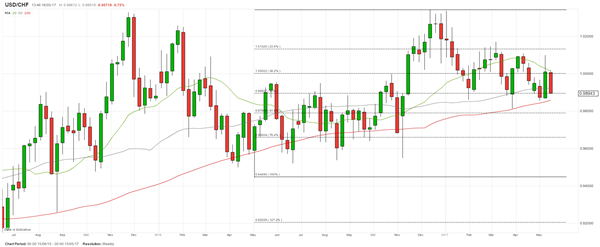
USDCHF is starting to look attractive again as technical indicators point to a reversal of the recent bear move from 1.03439 to a current price of 0.98938.
On the weekly chart, the pair is now trading below the 20- and 50-wma and is within touching distance of breaking below the 100-wma at 0.98580. This level is also dominated by a two lows on the daily chart around 0.98600, made on May 4 and May 5, providing a layer of support.
While markets may be turning bullish on the pair shortly, a break below the 0.98600 level could open up a move to the 61.8% Fibonacci retracement level at 0.97908, a level last seen six-months ago.
On a macro front, while investors are still happy taking on risk – equity markets are hitting multi-year and all-time highs – the CHF, a noted safe-haven currency, continues to get stronger
New to the markets? See our Trading Guides.
USDCHF: Weekly Timeframe (July 2015 – May 16, 2017)
And a look at the IG Client Sentiment shows that clients are long USDCHF which may point to the market moving lower and a better level for investors to put on a trade.
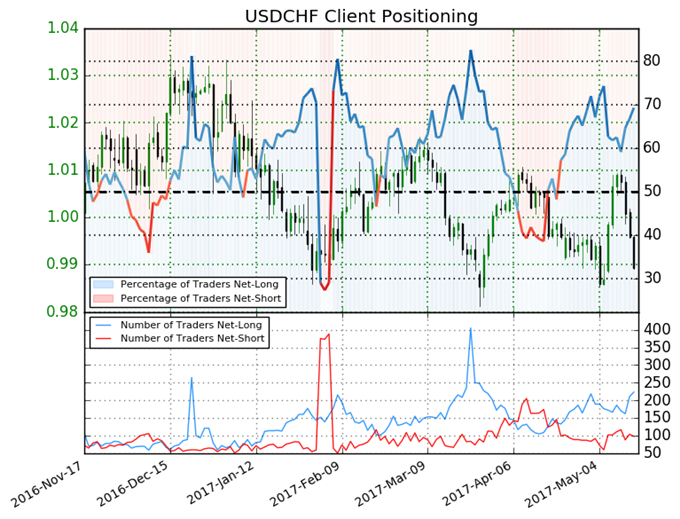
USDCHF: Retail trader data shows 69.3% of traders are net-long with the ratio of traders long to short at 2.26 to 1. In fact, traders have remained net-long since Apr 21 when USDCHF traded near 0.99754; price has moved 0.9% lower since then. The percentage of traders net-long is now at its highest since May 08 when USDCHF traded near 0.99842. The number of traders net-long is 34.1% higher than yesterday and 18.5% higher from last week, while the number of traders net-short is 6.5% higher than yesterday and 1.0% lower from last week.
Entry – Set up long USDCHF position at 0.98580.
Stop – Just under 61.8% Fibonacci level at 0.97900.
Target 1 – Fibonacci (38.2%) at 1.00025.
Target 2 – Fibonacci (23.6%) at 1.01322.
---Written by Nick Cawley, Market Analyst
You can follow Nick on Twitter @nickcawley1