FTSE 100, DAX 40, S&P 500 Analysis and Charts

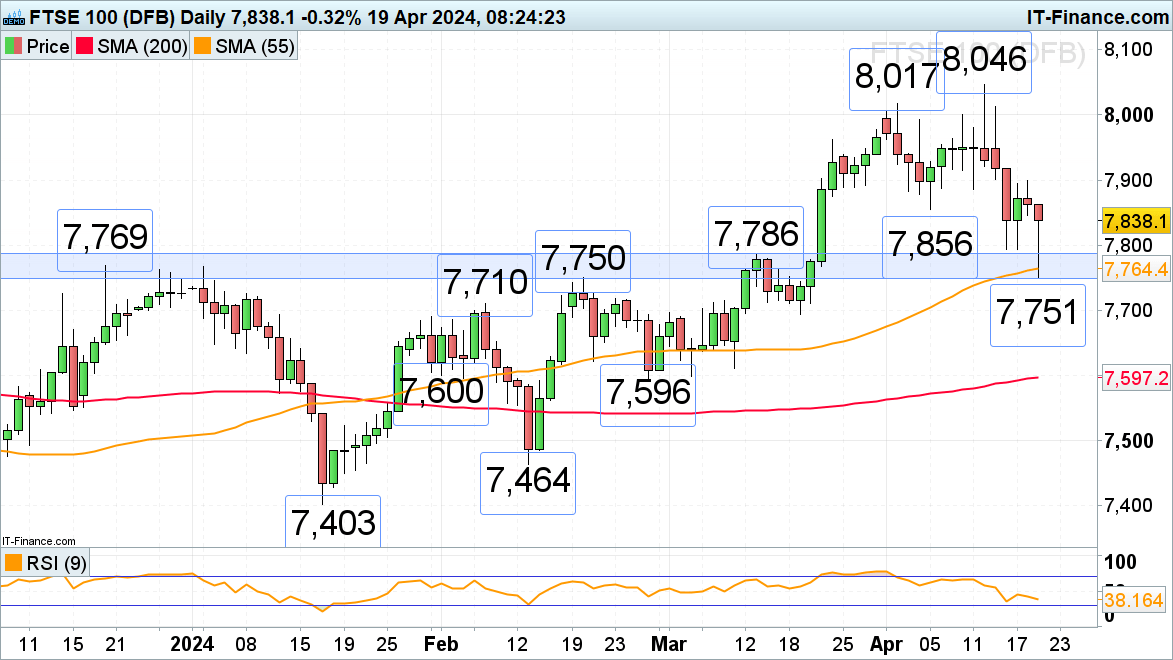
FTSE 100 stabilizes following sharp out-of-hours drop
The FTSE 100 dropped like a stone to its late February high at 7,751 as Israel fired missiles at Iran in a retaliatory attack in out-of-hours trading. Even though the index still opened lower, it has so far regained the majority of its intraday losses as hopes that further escalation will not take place become more prevalent.
While no rise above Thursday’s high at 7,899 is seen, the FTSE 100 remains under pressure and may revisit Tuesday’s low at 7,794.
Minor resistance sits at the early April 7,856 low.
FTSE100 Daily Chart
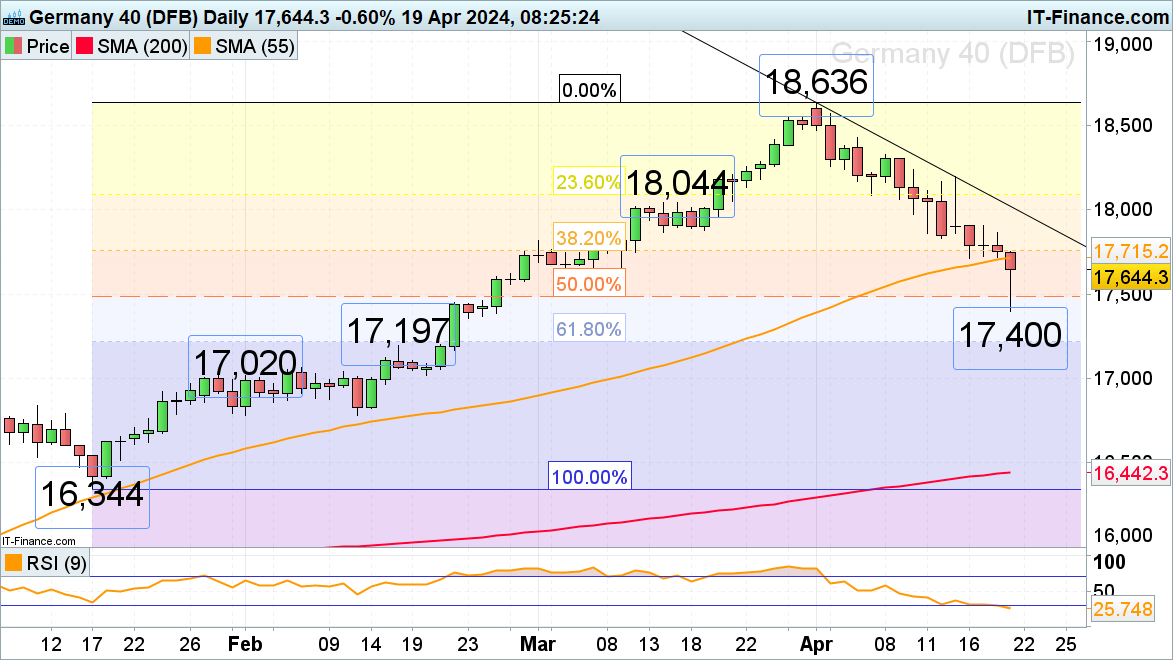
DAX 40 drops to levels last seen in February
The DAX 40 fell to levels last traded in late February when it hit the 17,400 mark on Middle East escalation as Israel launched missiles at Iran.
The index is trying to heave itself above the 55-day simple moving average (SMA) at 17,715 which may act as resistance with the 17,711 low seen on Tuesday. Further resistance sits at last Friday’s 17,831 low. For the bulls to be in control again in the short term, a bullish reversal and rise above Tuesday’s high at 17,903 needs to ensue.
Support is found at the 7 March 17,619 low and the 50% retracement of the mid-January to April advance.
DAX 40 Daily Chart
| Change in | Longs | Shorts | OI |
| Daily | 0% | 2% | 2% |
| Weekly | 17% | -3% | 3% |
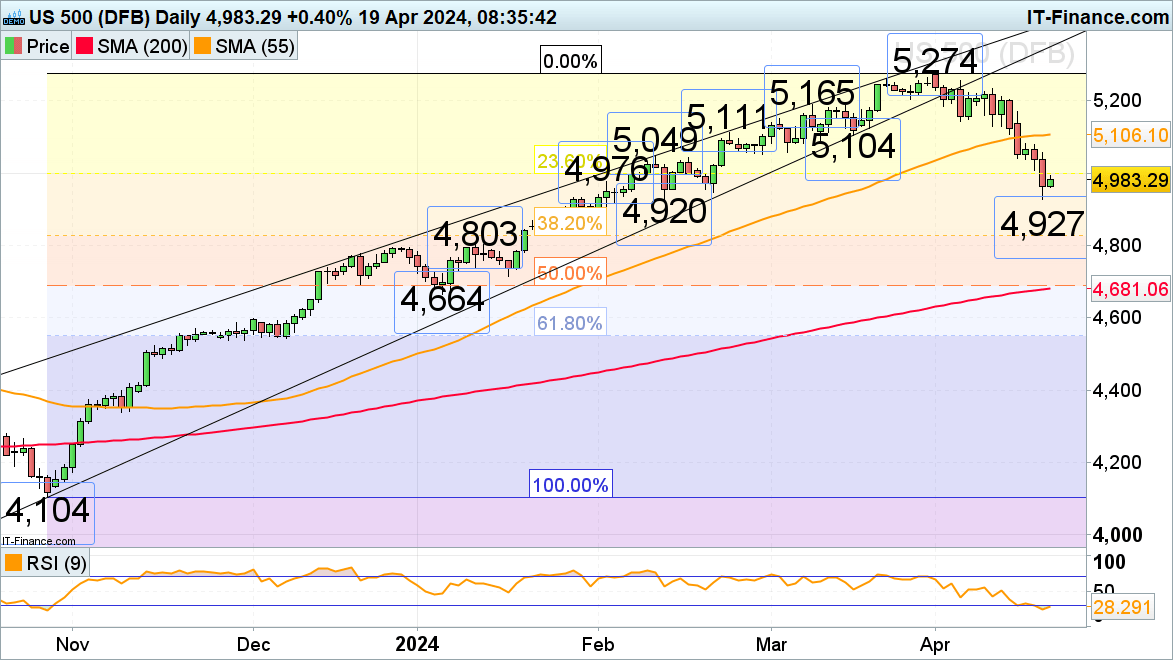
S&P 500 slips to two-month low
The S&P 500 is on track for its third consecutive week of losses as it hit levels last traded in mid-February at 4,927 amid a retaliatory missile strike by Israel on Iran.
The index is trying to remain above this low but will now have the psychological 5,000 mark to contend with which should act as resistance. Further up the mid-February high at 5,049 may also act as resistance.
Below today’s intraday low at 4,927 lies the 4,920 mid-February low.
S&P 500 Daily Chart