Dow Jones, Nasdaq 100, Nikkei 225 Analysis and Charts
Download our latest Q2 Equity Forecasts for Free

Dow recovery goes on
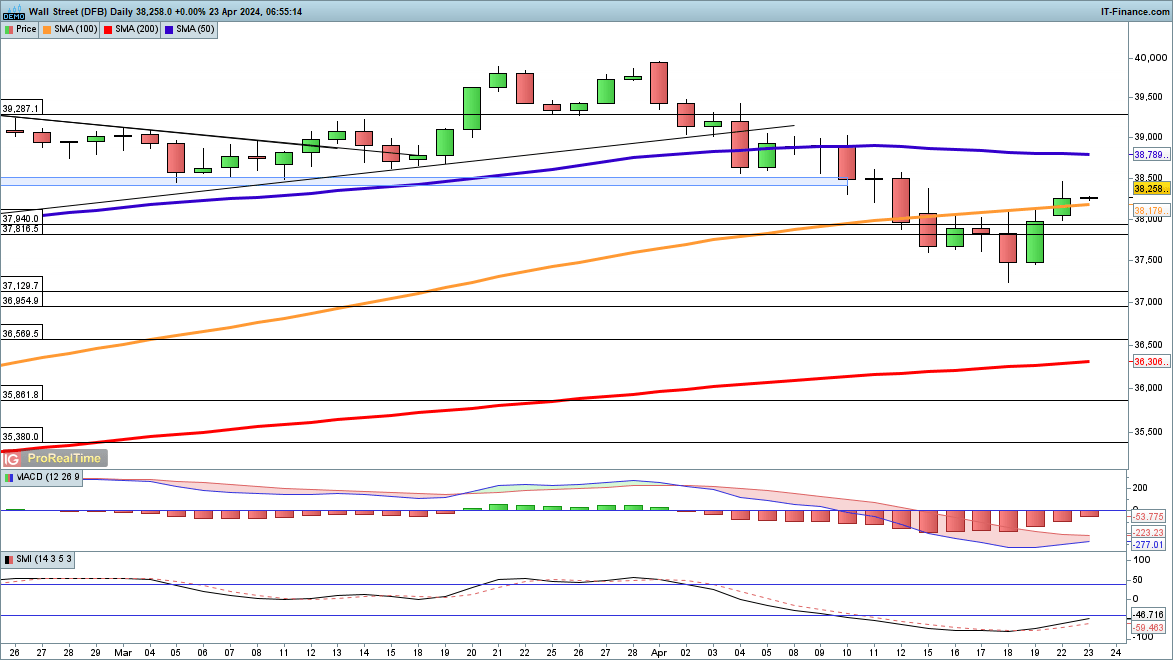
The index continues its recovery from the lows of last week, and Monday’s session saw it move back above the 100-day simple moving average. The flood of major earnings over the coming two weeks may mean that the index experiences a more volatile period, even if it does continue to rebound. Further gains target 39,000, which provided some resistance earlier in the month, and then on to 40,000.
A close back below 38,000 could suggest the price will head back towards 37,500, retesting last week’s low.
Dow Jones Daily Chart
Nasdaq 100 braces for big tech earnings
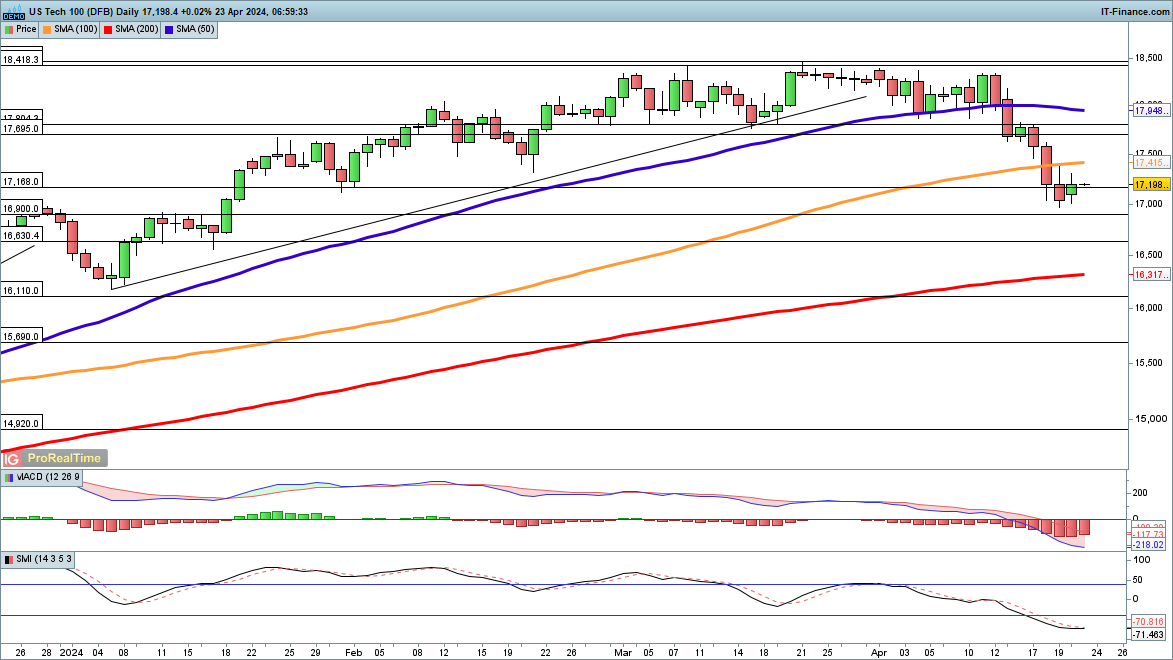
The pullback in the index paused yesterday, as the price reached 17,000. A small gain helped to suggest that a low may be forming.The big tech earnings that dominate this week and next may mean that the index struggles in the short-term, though with the percentage of index members below their 20-day SMA hitting 5% last week a short-term bounce still seems likely.
A close above 17,415 and the 100-day SMA helps to build a short-term bullish view. Sellers will want to see a close back below 17,000, which could then open the way to the January low at 16,177.
Nasdaq100 Daily Chart

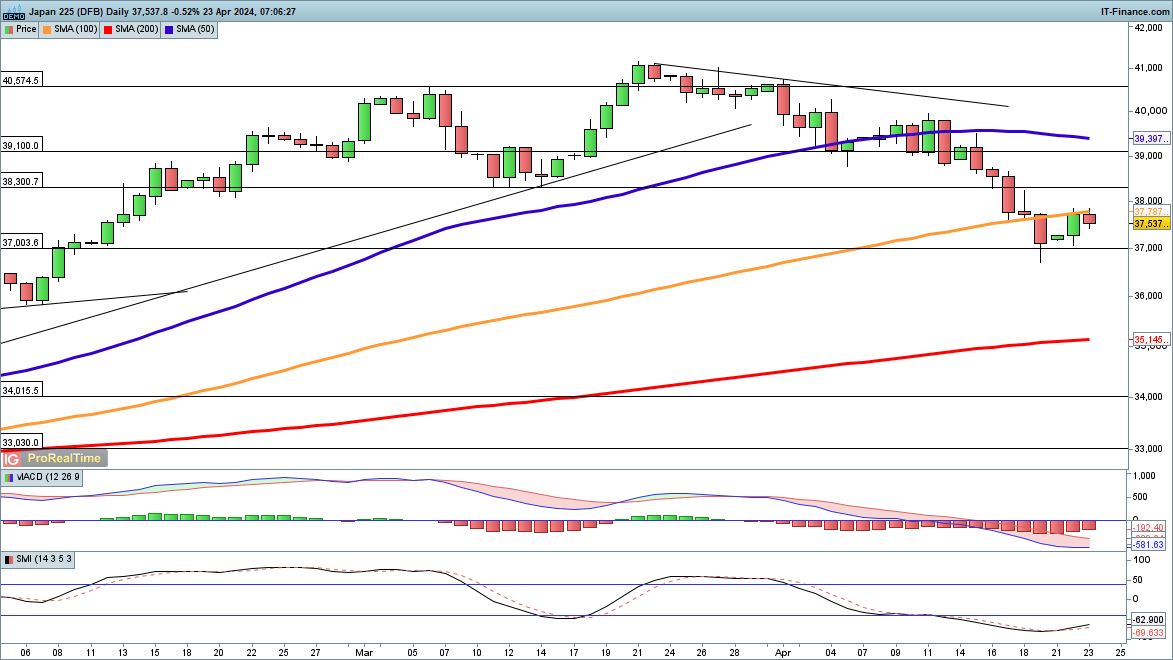
Nikkei 225 returns to 100-day SMA
As with other indices, the Nikkei 225 has seen its pullback pause over the past three sessions.Buyers appeared last week when the index dropped below 37,000, and the index then pushed back to the 100-day SMA. A close above the 100-day SMA would add strength to the bullish view, while the price then targets the early April highs around 39,860.
37,000 continues to hold as support for now, so a break below here is needed to put the bearish view back on track.
Nikkei 225 Daily Chart