


To receive Ilya's analysis directly via email, please SIGN UP HERE
Talking Points:
- USD/JPY Technical Strategy: Flat
- Support: 119.73, 119.32, 118.88
- Resistance: 120.17, 120.60, 121.14
The US Dollar continued to recover against the Japanese Yen, producing the first three-day winning streak in six weeks. Near-term resistance is at 120.17, the 50% Fibonacci retracement, with a break above that on a daily closing basis exposing the 61.8% level at 120.60. Alternatively, a turn below the 38.2% retracement at 119.73 clears the way for at test of the 38.2% Fib expansion at 119.32.
The available trading range is too narrow to justify entering a trade on the long or short side from a risk/reward perspective. With that in mind, we will remain flat for now, waiting for price action to offer a more compelling opportunity down the road.
Add these technical levels directly to your charts with our Support/Resistance Wizard app!
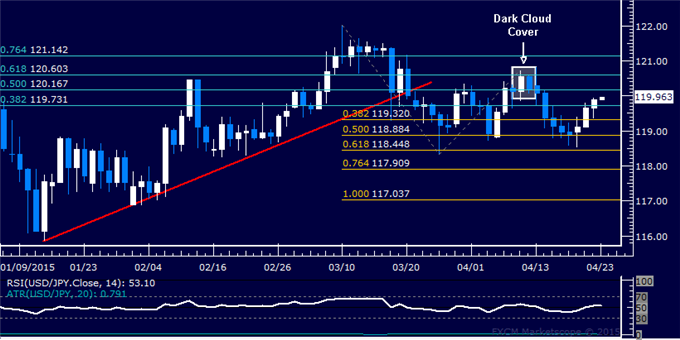
Daily Chart - Created Using FXCM Marketscope
--- Written by Ilya Spivak, Currency Strategist for DailyFX.com


