


Talking Points:
- US Dollar Setting its Sights on 12-Year Highs Once Again
- S&P 500 Inching Higher, Closing in on February Peak
- Crude Oil Range-Bound, Gold Tries to Launch Recovery
Can’t access the Dow Jones FXCM US Dollar Index? Try the USD basket on Mirror Trader. **
US DOLLAR TECHNICAL ANALYSIS – Prices moved upward as expected after completing a Triangle chart formation. A daily close above the 76.4% Fibonacci expansion at 12105 exposes the 12149-53 area (March 13 high, 100% level). Alternatively, a turn below the 61.8% Fib at 12076 opens the door for a challenge of the 50% expansion at 12052.
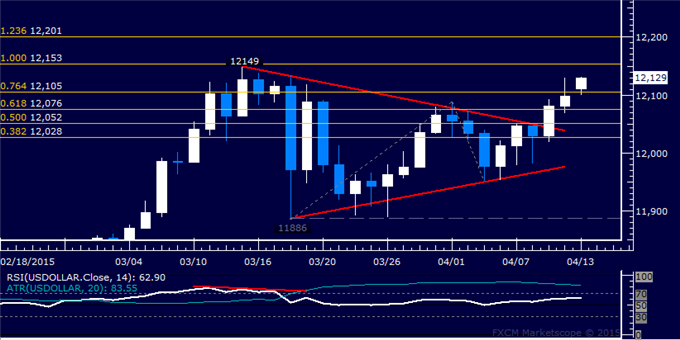
Daily Chart - Created Using FXCM Marketscope
** The Dow Jones FXCM US Dollar Index and the Mirror Trader USD basket are not the same product.
S&P 500 TECHNICAL ANALYSIS – Prices continue to push higher after taking out resistance at 2084.00, the 14.6% Fibonacci expansion. Buyers now aim to challenge the 2111.00-19.40 area (23.6% level, February 25 high), with a break above that exposing the 38.2% Fib at 2154.90. Alternatively, a move back below 2084.00 targets the March 12 low at 2040.10.
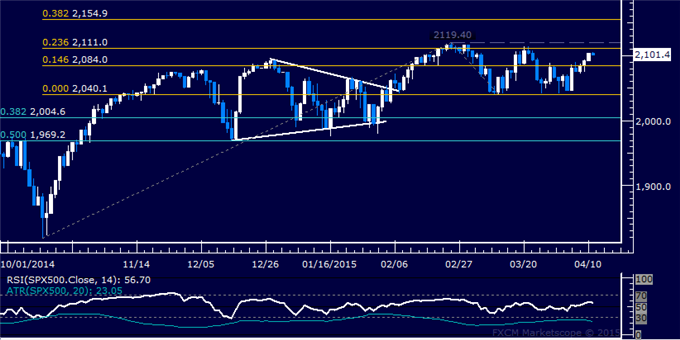
Daily Chart - Created Using FXCM Marketscope
GOLD TECHNICAL ANALYSIS – Prices bounced to re-test rising trend line support-turned-resistance at 1211.23, with a break above that on a daily closing basis exposing the April 6 high at 1224.15. Alternatively, a reversal below the April 9 low at 1192.48 targets the 23.6% Fibonacci expansion at 1185.23.
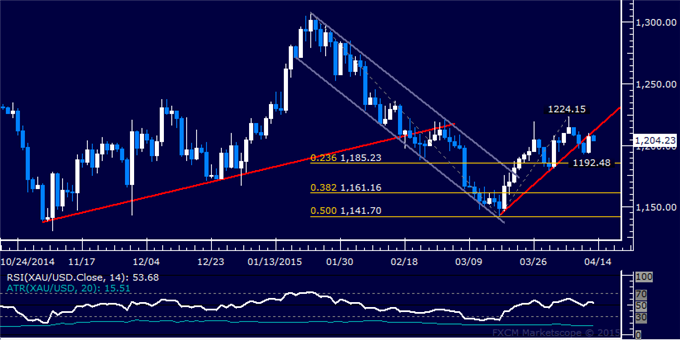
Daily Chart - Created Using FXCM Marketscope
CRUDE OIL TECHNICAL ANALYSIS – Prices continue to consolidate below the $60/barrel figure. A daily close below trend line support at 55.97 exposes the March 17 low at 52.55. Alternatively, a break above the 38.2% Fibonacci expansion at 59.35 targets the 50% level at 61.45.
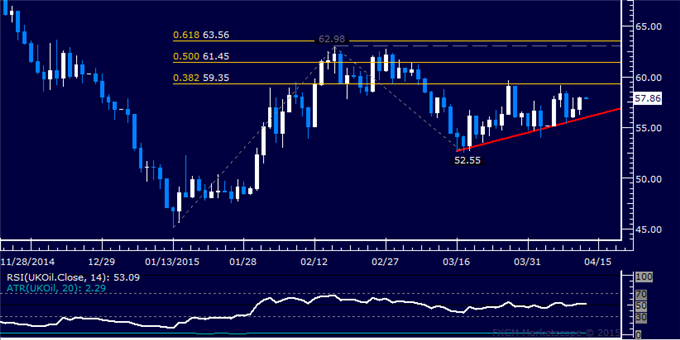
Daily Chart - Created Using FXCM Marketscope
--- Written by Ilya Spivak, Currency Strategist for DailyFX.com
To receive Ilya's analysis directly via email, please SIGN UP HERE
Contact and follow Ilya on Twitter: @IlyaSpivak


