


Talking Points:
- US Dollar Eyeing Range Support After Key Trend Break
- S&P 500 Technical Positioning Hints at Pullback Ahead
- Crude Oil Hits 2-Month High, Gold in Digestion Mode
Can’t access the Dow Jones FXCM US Dollar Index? Try the USD basket on Mirror Trader. **
US DOLLAR TECHNICAL ANALYSIS – Prices may have finally started to turn lower as expected following the appearance of a bearish Evening Star candlestick pattern. Near-term support is at 11740, the 14.6% Fibonacci retracement, with a break below that on a daily closing basis exposing the 23.6% level at 11653. Alternatively, a reversal above trend line support-turned-resistance at 11842 clears the way for a test of the 11854-76 zone (14.6% Fib expansion, March 2009 high).
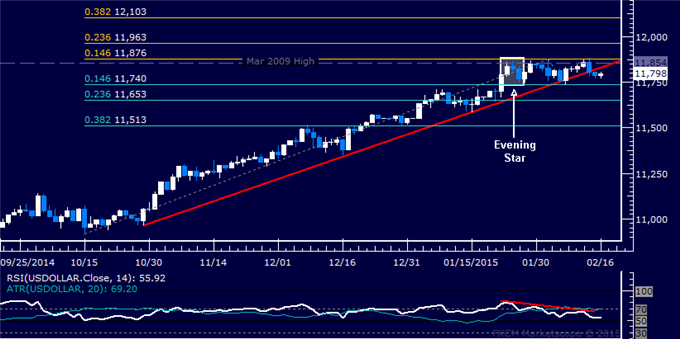
Daily Chart - Created Using FXCM Marketscope
** The Dow Jones FXCM US Dollar Index and the Mirror Trader USD basket are not the same product.
S&P 500 TECHNICAL ANALYSIS – Prices put in a bearish Dark Cloud Cover candlestick pattern, hinting a move lower may be ahead. A break below the 50% Fibonacci expansion at 2087.60 exposes the 38.2% level at 2076.60. Alternatively, a reversal above the 61.8% Fib at 2098.60 targets the 76.4% expansion at 2112.20.
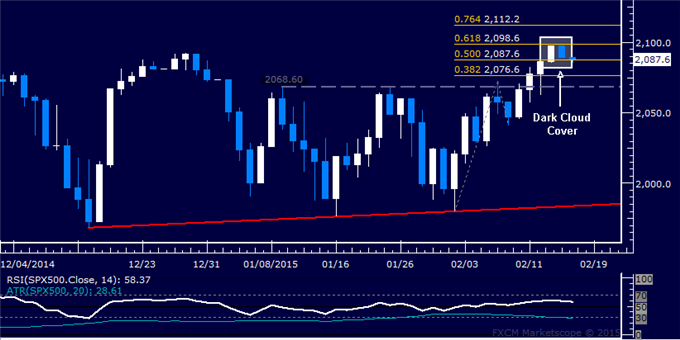
Daily Chart - Created Using FXCM Marketscope
GOLD TECHNICAL ANALYSIS – Prices continue to consolidate near support at 1218.80, the 50% Fibonacci retracement, with a break below that on a daily closing basis exposing the intersection of rising trend line support and the 61.8% level at 1197.86. Alternatively, a reversal above the 38.2% Fib at 1239.73 aims for the October 21 high at 1255.20.
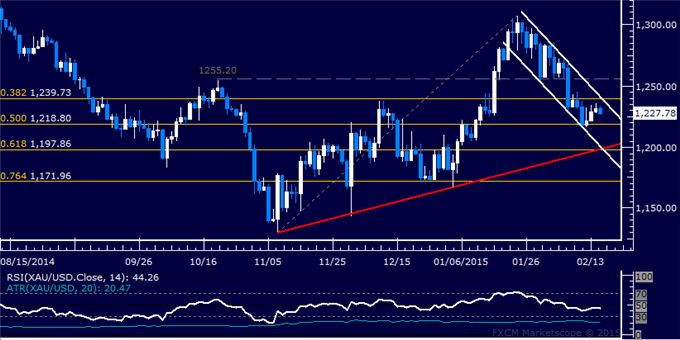
Daily Chart - Created Using FXCM Marketscope
CRUDE OIL TECHNICAL ANALYSIS – Prices continue to push higher after reversing upward as expected, with a break above the 50% Fibonacci retracement at 63.38 exposing the 61.8% level at 67.68. A reversal back below the 38.2% Fib at 59.08 aims for the 23.6% retracement at 53.77.
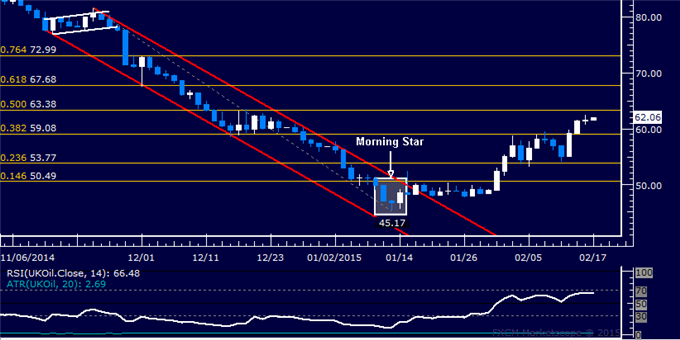
Daily Chart - Created Using FXCM Marketscope
--- Written by Ilya Spivak, Currency Strategist for DailyFX.com
To receive Ilya's analysis directly via email, please SIGN UP HERE
Contact and follow Ilya on Twitter: @IlyaSpivak


