


Talking Points
- Long Wicked Candles can mark significant reversal points at key areas of support and resistance
- Long Wicked Candles show excessive bullishness and bearishness that can be faded
- Though a lagging indicator, a MACD crossover can confirm a change in momentum
Traditionally, aggressive traders enter at market after a Forex Pin Bar is formed. However, the stop placed below the tail of a pin bar could be 200 or more pips. Many times, price will retrace back below the pin bar low stopping a trader out. In other instances traders end up getting chopped up in the market or face an opposing pin bar before exiting the trade at a loss.
Another approach would be to use a lagging indicator, like MACD, to confirm the reversal that was first indicated by the pin bar. Since the pin bar is short for Pinocchio bar, the fictional talking wooden puppet whose nose would grow when he told a lie, MACD can be used like a “lie detector” to confirm if the pin bar is “lying “ or “telling the truth”
Learn Forex: EURCAD Daily Chart Pin Bar
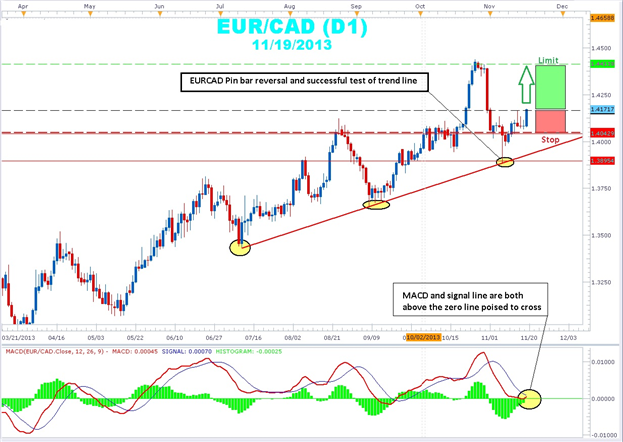
(Chart Created using Marketscope 2.0 charts)
In the example chart, we can see a strong EURCAD daily chart uptrend. A rising trend line created by a connecting the July 11th swing low at 1.3430 and the September 6th swing low at 1.3651 was successfully tested on November 7th by pin bar at 1.3884. The following day’s candle retraced nearly 62% of the pin bar before rebounding to the top of the pin bar at 1.4094. After ranging a bit, MACD starts moving towards its signal line and we get a large range confirmation candle breaking out of the congestion. Because MACD is an indicator composed of moving averages, it will, by nature lag behind sharp volatile moves and generate fewer false signals. This extra measure of safety is not without a cost, as price could continue to move and not retrace leaving the conservative trader behind. Traders who use this method must accept the fact they may miss trading opportunities.
Placing a stop below the area of congestion and targeting the November highs near 1.4413. We gave up about 90 pips on the trade in order to line up more confirming signals to take this trade but there is still close to 250 pips left and the risk to reward ratio is better than 1:2. MACD crossing over its signal line, combined with a continuation breakout following a bullish daily chart pin bar stack up for a solid trade.
Traits of Successful Traders research by FXCM of over 12 million real trades by clients worldwide in 2009 and 2010 revealed that the number one mistake that traders made was losing more on each losing trade than they made on each winning trade. Lining up as many confirming signals before entering a trade and not relying on only one indicator may help reduce the number of bad trades.
--- Written by Gregory McLeod, Trading Instructor
To contact Gregory McLeod, email gmcleod@dailyfx.com.
To be added to Greg’s e-mail distribution list, please click here.
Follow me on Twitter @gregmcleodtradr.
This article showed you how to combine MACD with the Pin bar candlestick pattern to enter a trade. If you want to expand your knowledge of price action candlesticks, then sign my guestbook and enroll now in a free Candlestick Trading Course. A short 20-minute class will help you become a "Candlestick Master"!


