
US Dollar Weekly Technical Forecast: Bullish
- US Dollar remains in a bullish posture versus its peers
- EUR/USD focused lower after 200-day MA breakout
- GBP/USD bearish Head & Shoulders underscores drop

The US Dollar remains in a bullish posture against the Euro heading into the new trading week. On the daily chart below, EUR/USD can be seen in a downtrend since July. Over the past few weeks, the exchange rate confirmed a breakout under the 200-day Moving Average, opening the door to an extended move lower.
Since then, prices fell through the 1.0766 inflection zone before reaching the May low of 1.0635. Guiding prices lower has been the falling trendline from July. As such, it would take a breakout above this point, with confirmation, to open the door to a bullish technical bias. Breaking lower exposes the march low of 1.0516. In the event of an extended move higher, keep a close eye on the 61.8% Fibonacci retracement level of 1.088.
| Change in | Longs | Shorts | OI |
| Daily | -1% | -4% | -3% |
| Weekly | -18% | 17% | 1% |
EUR/USD Daily Chart

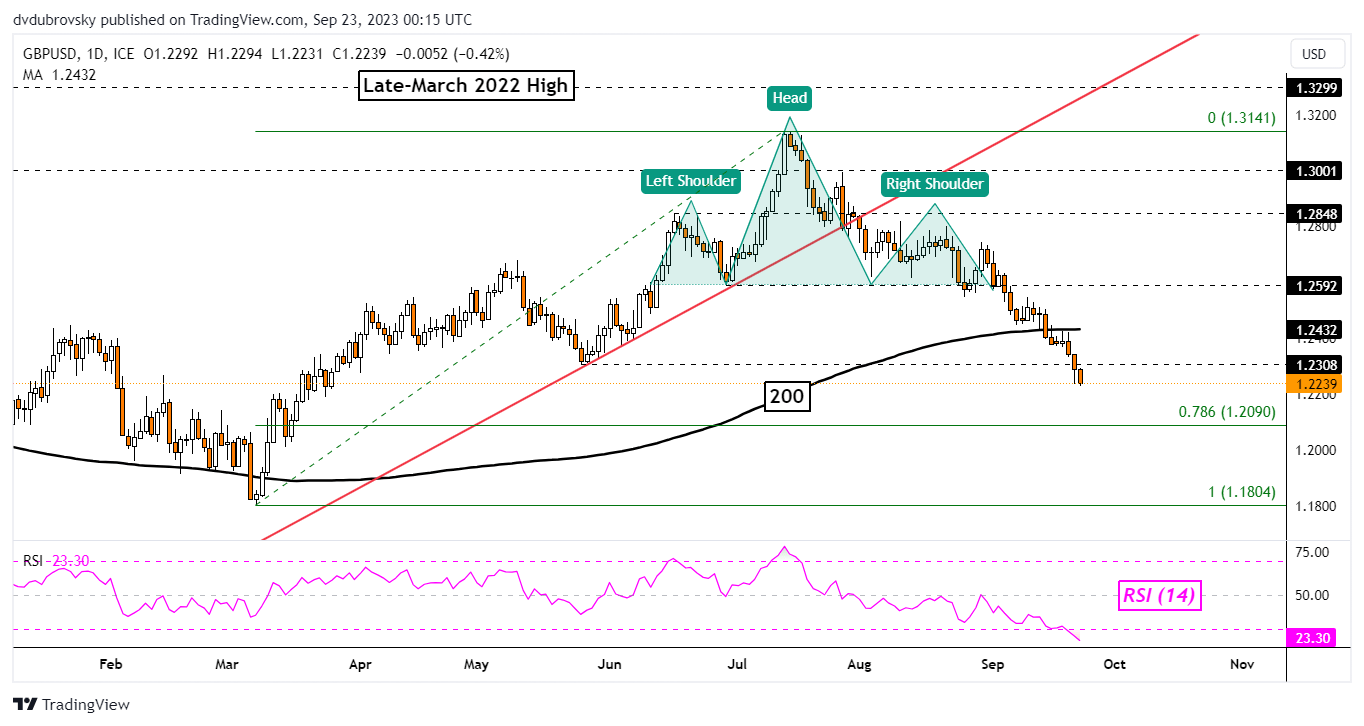
Meanwhile, the US Dollar also remains in a bullish posture against the British Pound. GBP/USD has continued extending losses in the aftermath of a Bearish Head & Shoulders chart formation. Like the Euro, Sterling has also confirmed a breakout under the 200-day Moving Average, opening the door to an extended move lower.
Key support is the May low of 1.2308, which in the event of further losses, could hold as new resistance if prices bounce. The 78.6% Fibonacci retracement level sits below at 1.209. It is standing in the way of reaching the March low of 1.804. Should prices make an extended move higher, keep a close eye on the neckline of the Head & Shoulders around 1.2592.

GBP/USD Daily Chart
--- Written by Daniel Dubrovsky, Senior Strategist for DailyFX.com