


Silver Technical Analysis
- Silver drops from the top of a defined channel to the bottom in search of support
- The analysis in this article makes use of chart patterns and key support and resistance levels. For more information visit our comprehensive education library

Silver Attempts to Find Support at Well-Known Level
Silver, much like gold, has witnessed an impressive run up which has recently come under threat. An approach of the zone of resistance with a midpoint of 25.00 – which has halted bullish price action in the past - proved too much to handle once again, resulting in a decline of over 10% during the last 4 trading days.
The weekly chart below helps reveal the band that has contained the majority of price action since September 2021. The obvious exceptions to this can be seen on the chart but in the absence of a strong enough catalyst with lasting momentum, price action outside of this band has ultimately failed to inspire a new trend.
Once more, we find ourselves at the bottom of the band, testing the upper side of the zone of support (21.40-22.10). It’s not been uncommon to see extended lower wicks attempting to pierce beneath the zone of support in prior attempts, signaling the persistence of bulls within this zone.
Silver (XAG/USD) Weekly Chart
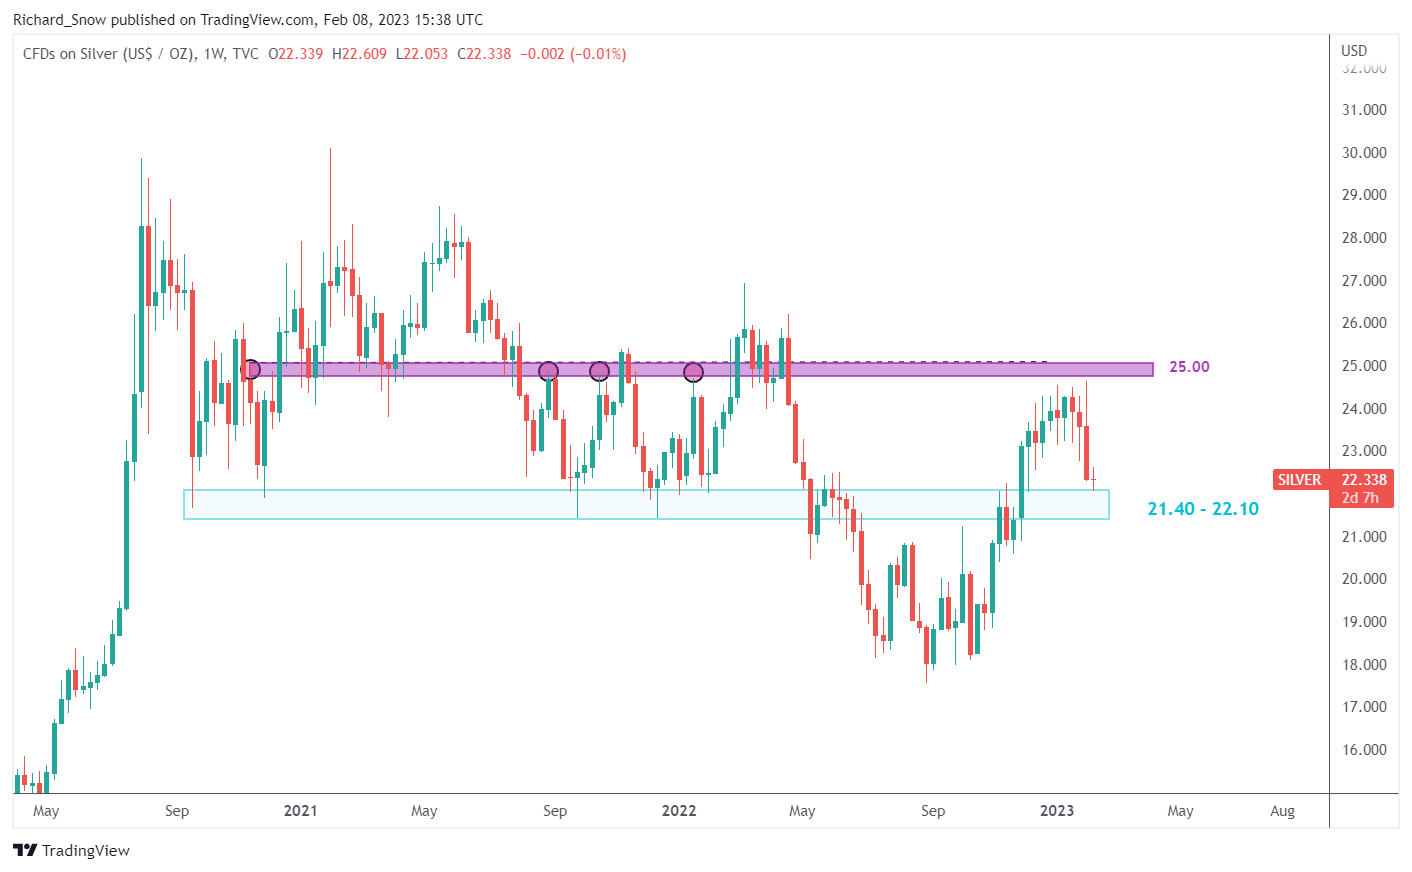
Source: TradingView, prepared by Richard Snow
Upon closer inspection via the daily chart, it is easier to see the level of indecision at current levels as Monday and Tuesday’s price action had little between them with today showing a slight move higher but remaining close to flat.
The nearest challenge for a bullish reversal presents itself via the 38.2% Fibonacci retracement of the major 2021-2022 decline. This week, prices have attempted to close above the line but failed on both attempts with today appearing as if we could see a continuation of this pattern. A close above the 38.2% Fib opens up the possibility of a move towards the 50% Fib and the upper side of the band at 25.00.
While the 200 simple moving average (SMA) suggests the long-term uptrend remains in play, shorter and medium-term indicators in the 20 and 50 SMA appear above the current price level on the cusp of a bearish crossover. A daily close beneath 21.40 suggests the bearish move has the potential further downside and would need to be monitored for bearish continuation setups.
Silver (XAG/USD) Daily Chart
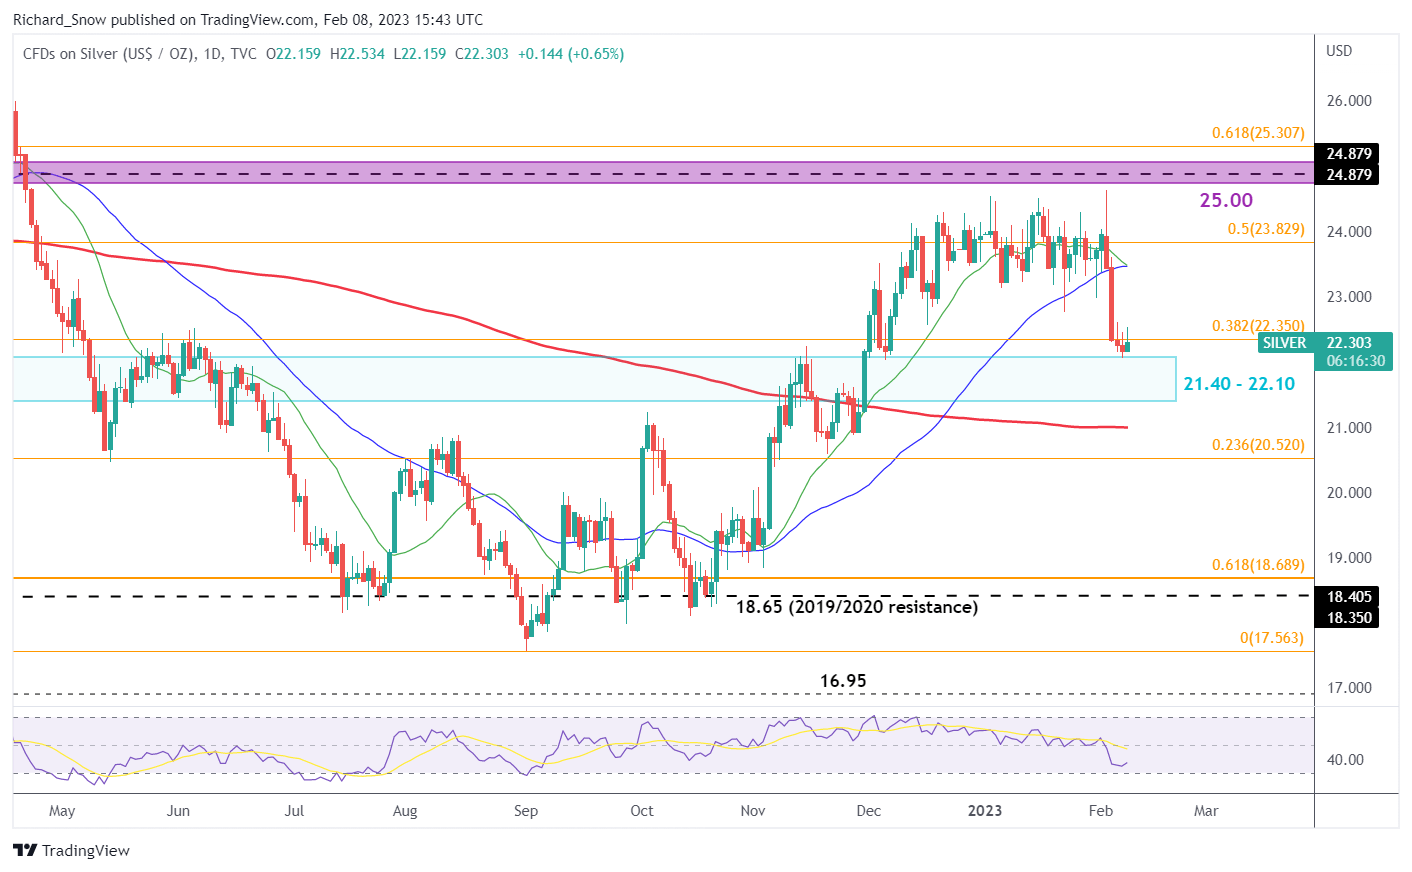
Source: TradingView, prepared by Richard Snow
Trade Smarter - Sign up for the DailyFX Newsletter
Receive timely and compelling market commentary from the DailyFX team
--- Written by Richard Snow for DailyFX.com
Contact and follow Richard on Twitter: @RichardSnowFX


