


US Stocks (SPX) Analysis
- S&P 500 struggles to capitalize on gap to the upside despite yields hitting 3-month low
- SPX nears retest of yearly high but bullish fatigue may delay any such ambitions
- IG client sentiment mixed despite 65% of traders short this market
- The analysis in this article makes use of chart patterns and key support and resistance levels. For more information visit our comprehensive education library
S&P 500 Struggles to Capitalise on Gap to the Upside
The S&P 500 may soon witness a slight slowdown as the current (mature) bullish advance risks overheating. US equities have continued to build on prior gains as markets defiantly price in a greater number of 2024 rate hikes which are now anticipated to start in May next year, up from June. With markets being forward-looking in nature, rate cuts bode well for stocks as a lower future interest rate props up the current value of stock prices.

SPX nears retest of yearly high but bullish fatigue may delay any such ambitions
A slightly lower dollar and US yields trading at a 3-month low appear to be insufficient motivation to push the index higher and register a retest of the 2023 high of 4607. The index has traded within a narrow band over the last week, with the upper band at 4607 and the lower band at 4540. With the JOLTs report and ADP private payrolls already in the public domain, prices may continue to be contained within the trading range until Friday’s NFP data which is expected to reveal slightly more jobs added in November comparted to October. The JOLTs report revealed fewer job openings than expected and the private payrolls disappointed but still posted a net gain – data that is unlikely to reverse the dovish interest rate bets.
The RSI has already recovered from overbought territory and the MACD indicator is on the verge of revealing a bearish crossover as bullish momentum fatigues. It would appear that only a significant upside beat on Friday’s NFP data could send the index below 4540, towards 4450 and if this week’s jobs data is anything to go by, that appears unlikely.
S&P 500 Daily Chart
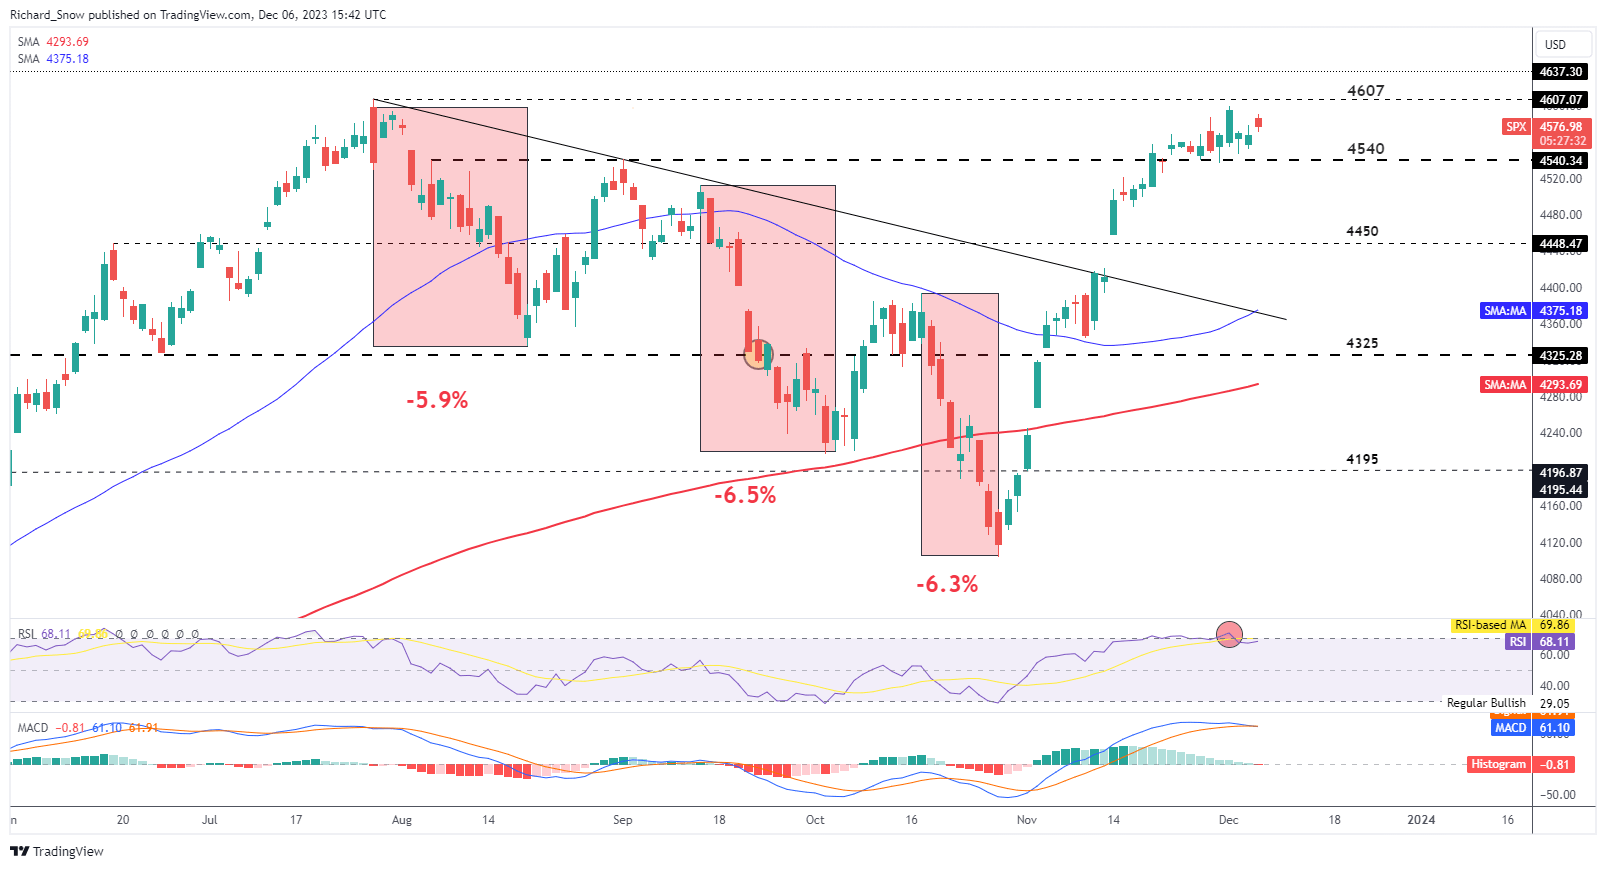
Source: TradingView, prepared by Richard Snow
The weekly chart helps to identify potential upside levels of interest with the first being that retest of 4607 followed by the 4637 level corresponding with the March 2022 high.
S&P 500 Weekly Chart
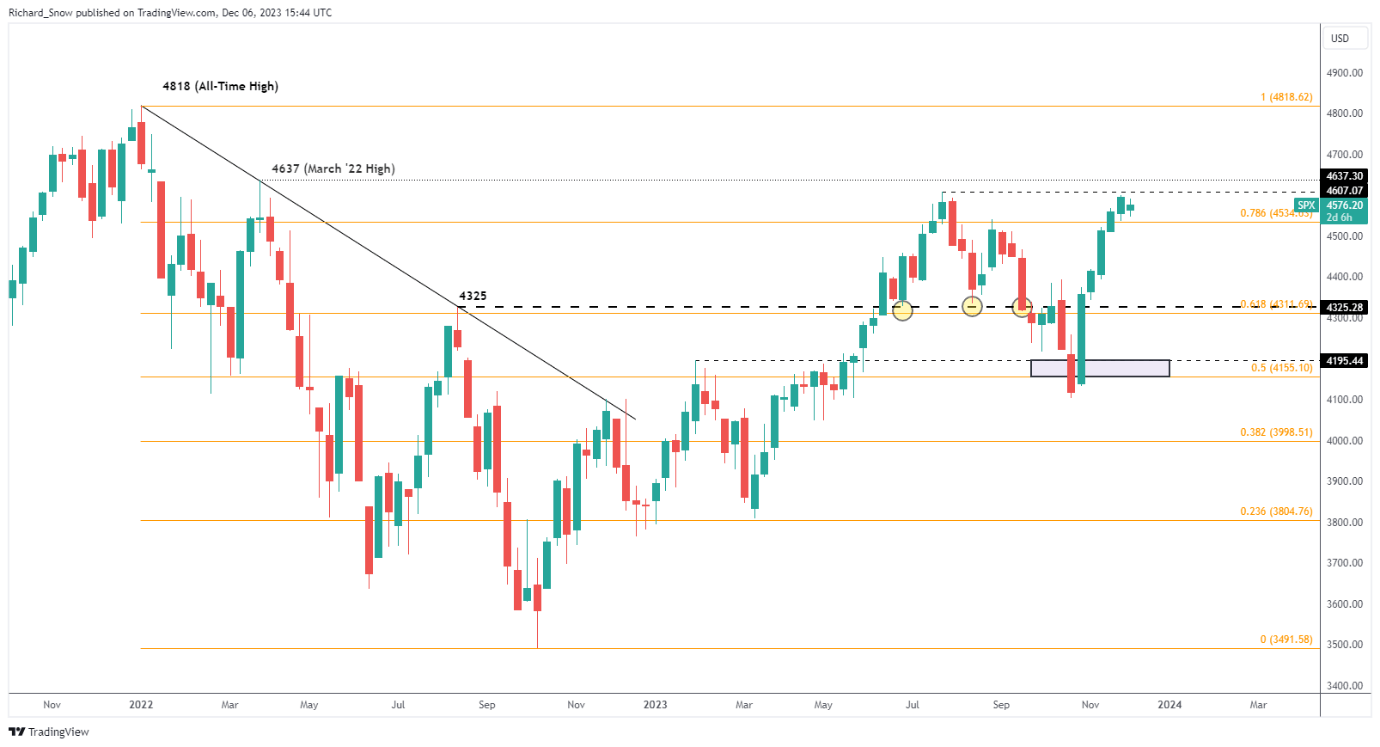
Source: TradingView, prepared by Richard Snow
IG Client Sentiment Mixed Despite 65% of Traders Net Short
Positioning continues to diverge but recent changes in long and short sentiment provide little assistance.
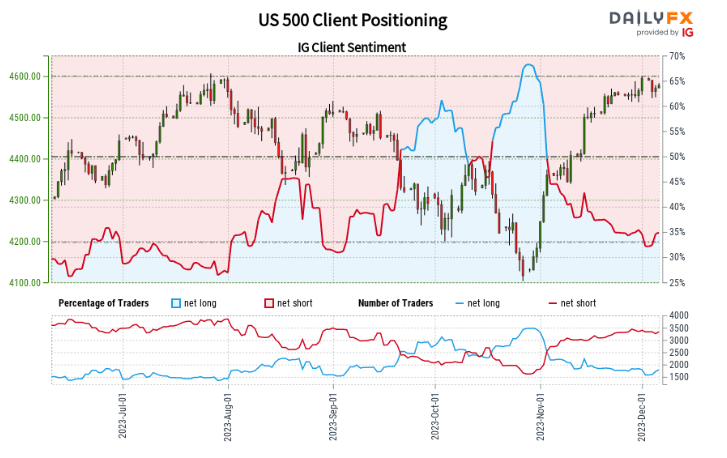
Source: IG/DAILYFX
US 500:Retail trader data shows 35.00% of traders are net-long with the ratio of traders short to long at 1.86 to 1.
We typically take a contrarian view to crowd sentiment, and the fact traders are net-short suggests US 500 prices may continue to rise.
The combination of current sentiment and recent changes gives us a further mixed US 500 trading bias.
To find out more about IG client sentiment and how it can form part of a trend trading setup, read the dedicated guide on the topic below:
| Change in | Longs | Shorts | OI |
| Daily | -7% | 4% | -1% |
| Weekly | -1% | 3% | 1% |
--- Written by Richard Snow for DailyFX.com
Contact and follow Richard on Twitter: @RichardSnowFX


