
Long USD/CAD: Rate Differential and Price Action Support Further Upside Narrative.
The Canadian Dollar has suffered against the Greenback since the Bank of Canada (BoC) announced a pause to its hiking cycle. The BoC started out very aggressively when hiking rates and if recent inflation data is anything to go by the BoC may have gotten it right, one of the few Central Banks who are seeing results thus far when it comes to the inflation fight. The YoY inflation rate in Canada has been on a steady decline since a peak print of 8.1 % in June 2022 with the February 2023 figure showing a drop of 0.7% coming in at 5.2% (Estimates of 5.9%). Of course, this trade seemed more of a slam dunk about two weeks ago but the recent banking sector turmoil out of the US has seen the Fed funds peak rate expectations for 2023 take quite a dive and put pressure on the US Dollar.
The recent FOMC meeting (March 21-22) however saw the FED continue their hiking cycle with markets pricing in a further hike in May before a pause. Fed Chair Powell stated that the chance of cuts this year remains slim despite the tightening credit conditions. Whether or not we get a rate hike in May the technical outlook and fundamentals still support further upside in USDCAD in my opinion.
TECHNICAL ANALYSIS
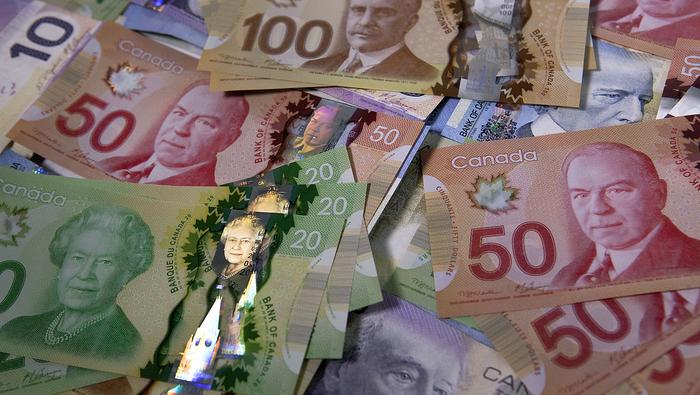
USD/CAD WEEKLY CHART
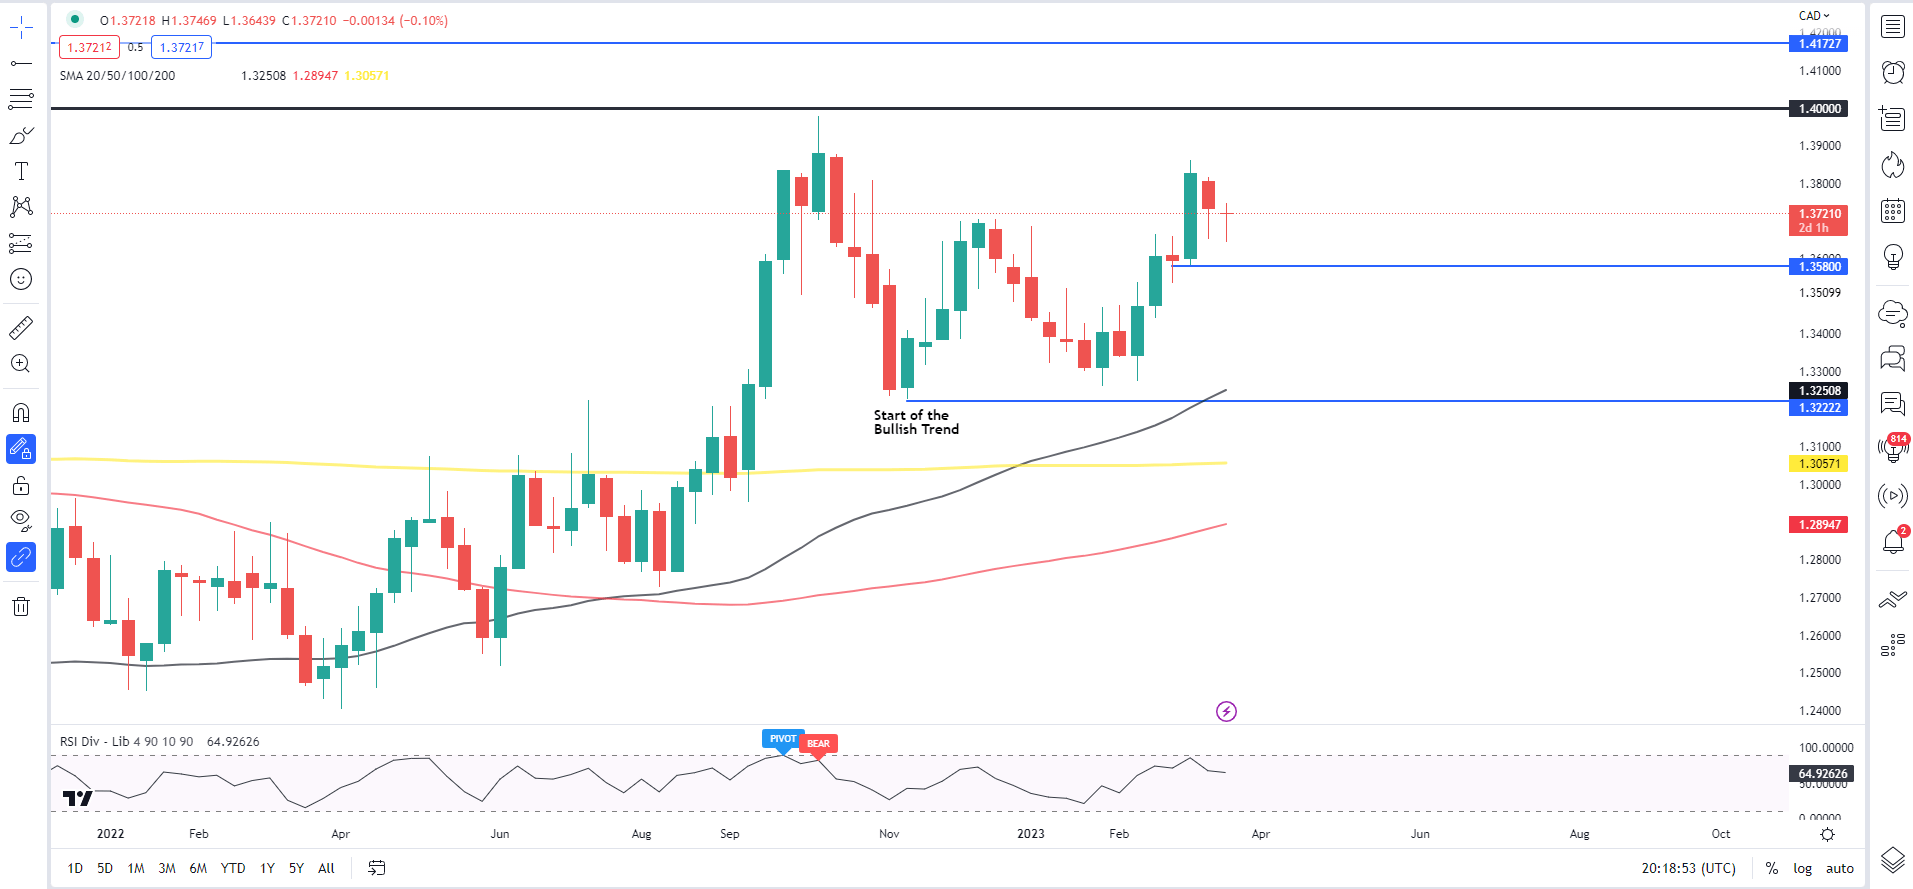
Chart prepared by Zain Vawda, using TradingView
From a technical perspective, looking at the overall structure on a weekly timeframe we have made a series of higher highs and higher lows since the November 2022 swing low.
On the Daily Chart below, we also have just seen a golden cross develop with the 50-day MA rising above the longer-term 100-day MA which is usually indicative of a strong bull market.
USD/CAD DAILY CHART
Chart prepared by Zain Vawda, using TradingView
Looking at the potential scenarios which could come into play on USDCAD, the most risk-averse entry opportunity is likely to present itself with a break and candle close above the trendline or a break and then a potential retest. However, there is also the possibility of a push down toward the support level of 1.3660-1.3650 which provides an even better risk to reward opportunity. A break of this support does not invalidate the bullish bias however with long term support at the previous swing high on the weekly timeframe at 1.3300 holding the key to a shift in bias. A weekly candle close below the 1.3300 handle would invalidate the bullish setup.
Upside resistance and potential target areas rest around 1.3850, the psychological 1.4000 level, and 1.4170 handle respectively.
Contact and follow Zain on Twitter @zvawda