


Gold (XAU/USD) Analysis, Prices, and Charts
- Gold looking to push higher despite quiet conditions.
- Gold ignoring higher US bond yields.

Gold is edging higher in a quiet market and looks ready to re-test both $2,000/oz. and the recent multi-month high at a fraction under $2,010/oz. The precious metal is holding its own against rising US government bond yields today, although low volume conditions may be distorting both markets. The only data release of note today, flash S&P PMIs at 14.45 UK, may add a bout of volatility but market conditions are likely to remain quiet until next week.
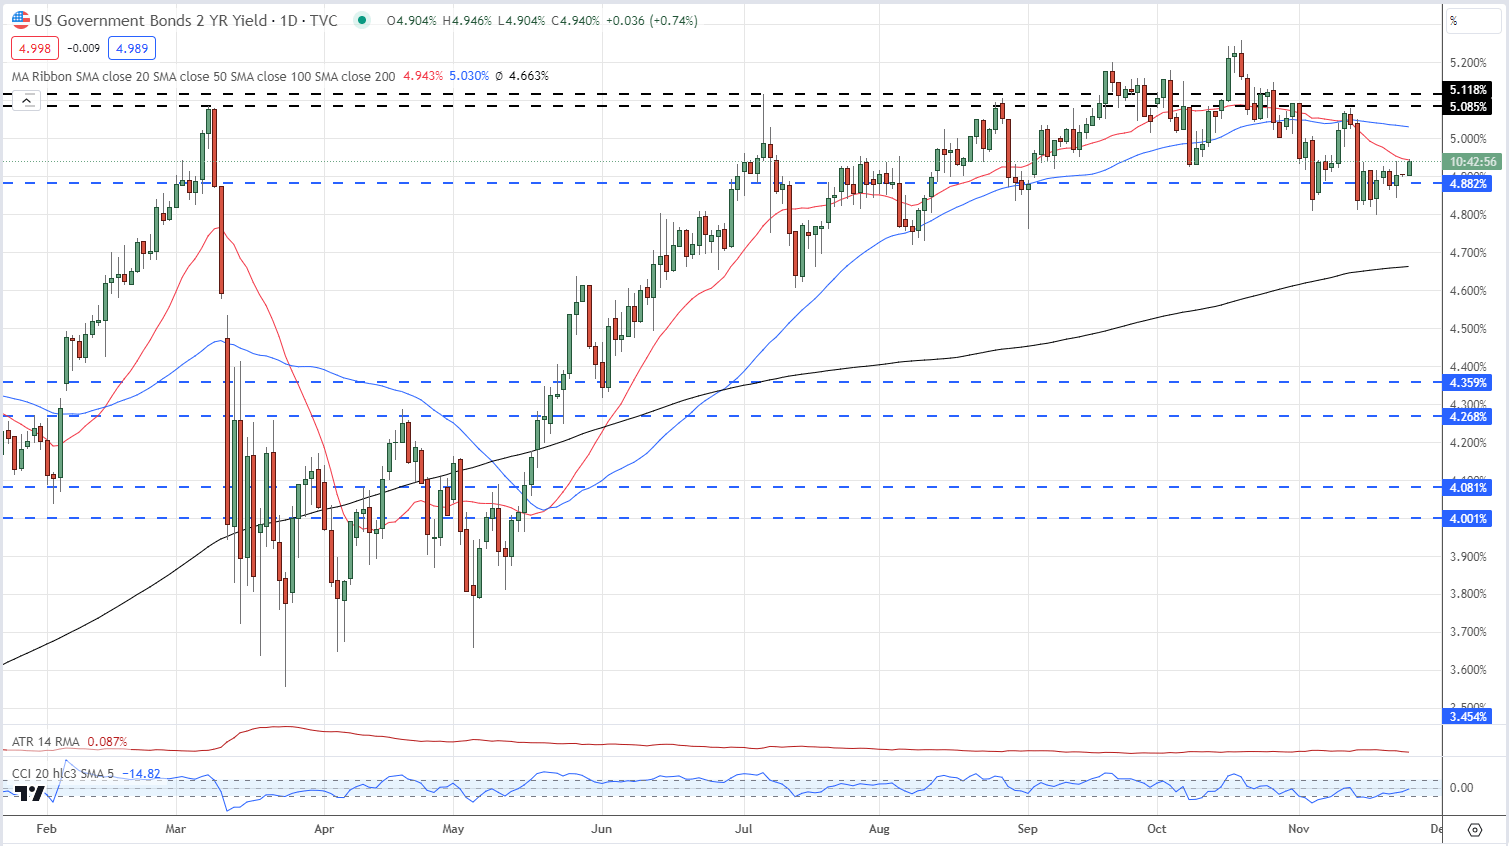
US Treasury bond yields are edging higher with the rate-sensitive 2-year now offered at 4.95%, around 15 basis points than one week ago. Next week sees heavy short- to medium-term UST issuance with a total of $148 billion of 2s, 5s, and 7s up for sale. Traders are likely pushing yields higher ahead of these auctions to get more value for their money.
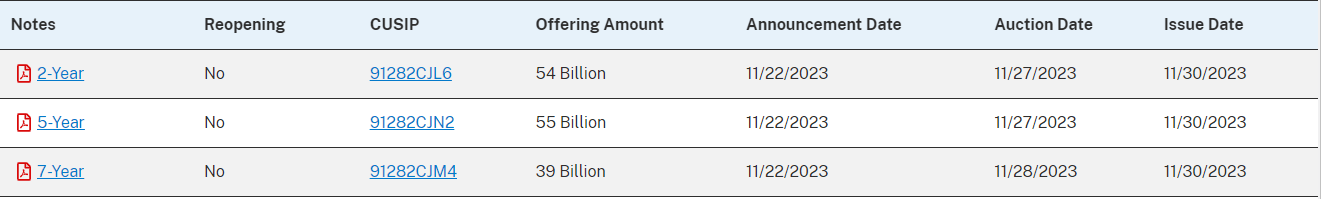
US Treasury 2-Year Yield – November 24, 2023

The daily gold chart retains a positive outlook and another test of the recent high is looking likely. The 20-day simple moving average is now acting as support, along with the 50- and 200-day smas, while a prior level of note at $1,987/oz. has also been supportive in this week. Below here, support is seen from the 23.6% Fibonacci retracement level at $1,972/oz. If resistance is broken convincingly then $2032/oz. and $2049/oz. come into play.
Gold Daily Price Chart – November 24, 2023
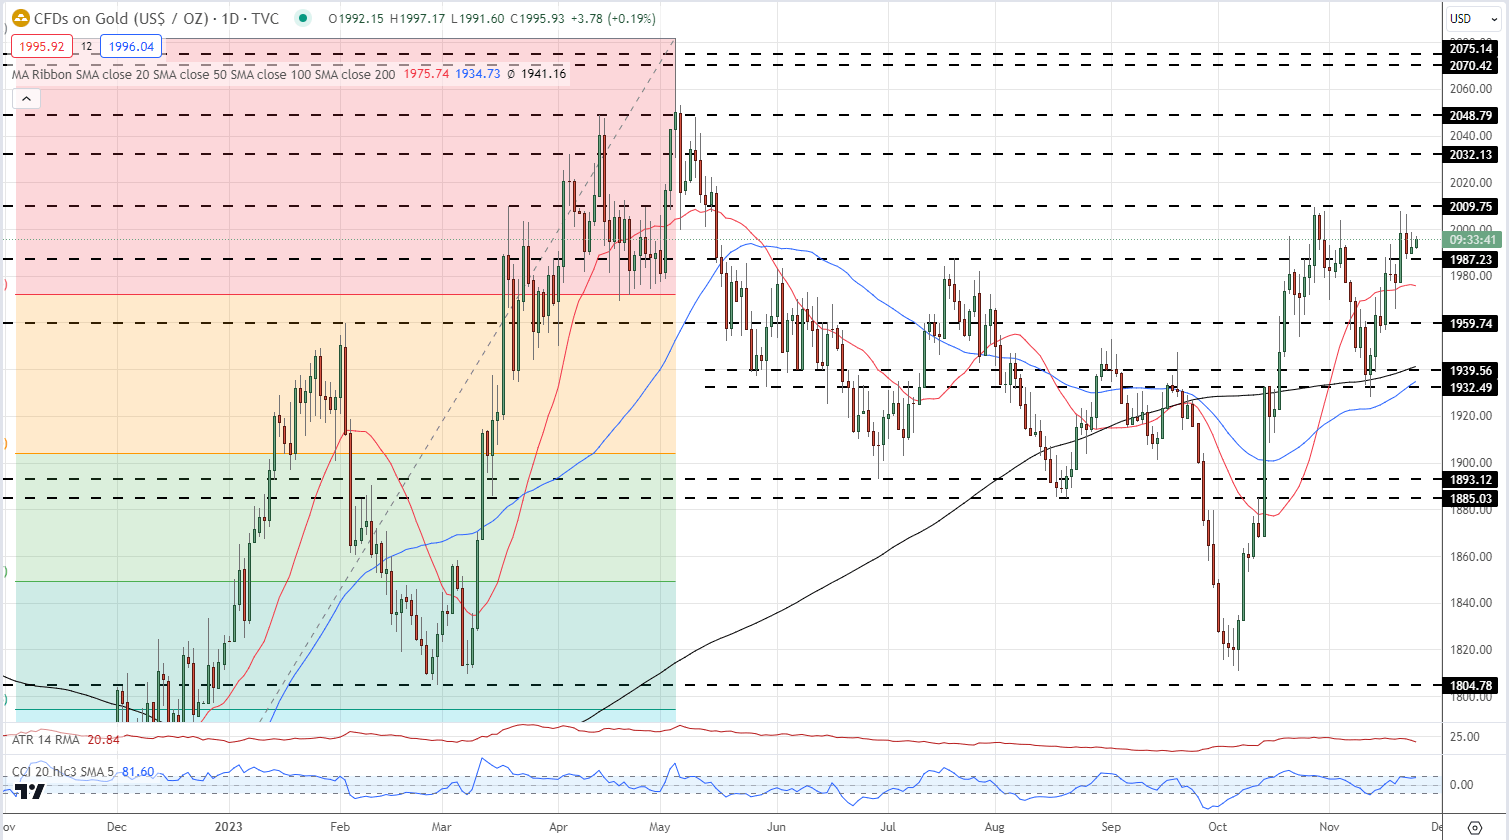
Charts via TradingView
IG Retail Trader data show 58.19% of traders are net-long with the ratio of traders long to short at 1.39 to 1.The number of traders net-long is 5.21% higher than yesterday and 2.55% lower than last week, while the number of traders net-short is 2.88% lower than yesterday and 12.79% higher than last week.
Download the latest Gold Sentiment Report to see how daily and weekly changes affect price sentiment
| Change in | Longs | Shorts | OI |
| Daily | 5% | 6% | 6% |
| Weekly | 1% | -7% | -3% |
What is your view on Gold – bullish or bearish?? You can let us know via the form at the end of this piece or you can contact the author via Twitter @nickcawley1.


