


Gold (XAU/USD) Analysis, Prices, and Charts
- US bond yields hit fresh multi-year highs.
- Gold readying for another shot at $2k.
Learn How to Trade Gold with our Free Guide

The precious metal made an attempt to break $2,000/oz. late Friday but was unable to keep the momentum going for long enough. The ongoing crisis in the Middle East remains the driving force behind the recent gold rally as haven buyers boost the price of the precious metal. Gold is now consolidating around $1,980/oz. and looks set to re-test big figure resistance in the coming days despite soaring US Treasury yields.
US Treasury yields continue to push higher, despite the Middle East conflict. US debt normally acts as a flight-to-safety asset class due to its government backing and liquidity. However, it looks as though sellers have control of the market currently as yields continue to press higher. The public debt of the US is now in excess of $33 trillion and rising US Treasury yields make new borrowing even more expensive. In October 2021, the US national debt was $28.9 trillion.
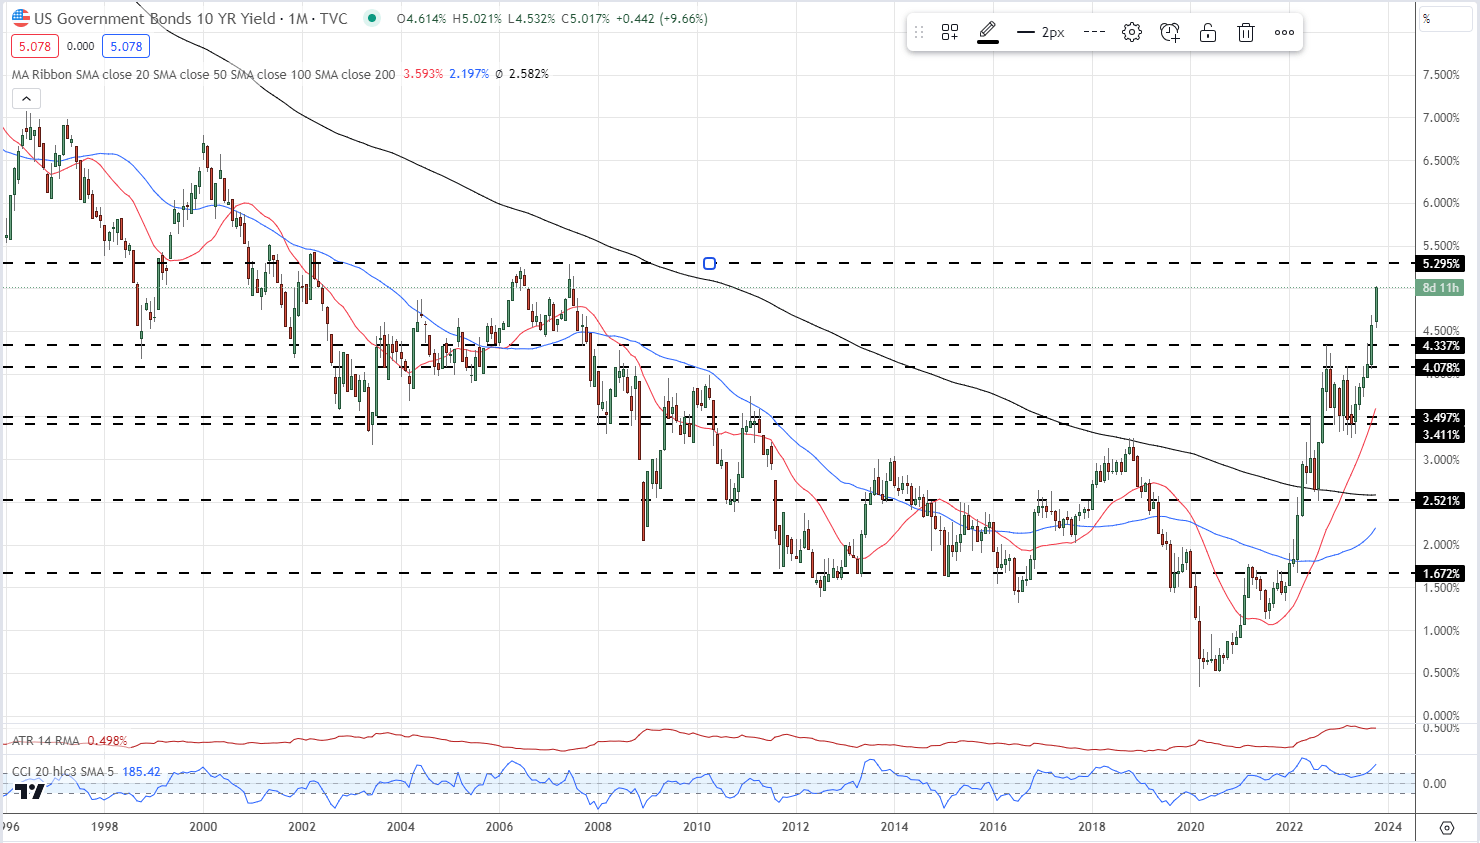
The closely followed US 10-year benchmark is now trading with a yield of 5.019%, its highest level since July 2007. A break above the July 2007 high of 5.29% would see yields back at levels last seen in early 2002.
US 10-Year Yield Monthly Chart

Gold continues to perform strongly despite the mixed backdrop. The precious metal failed at the first attempt to break $2,000/oz. at the end of last week and looks set to consolidate before making a fresh attempt. A break of $2,000/oz. should see $2,009/oz. come into play fairly quickly. Initial support is seen around $1,960/oz.
Gold Daily Price Chart – October 23, 2023
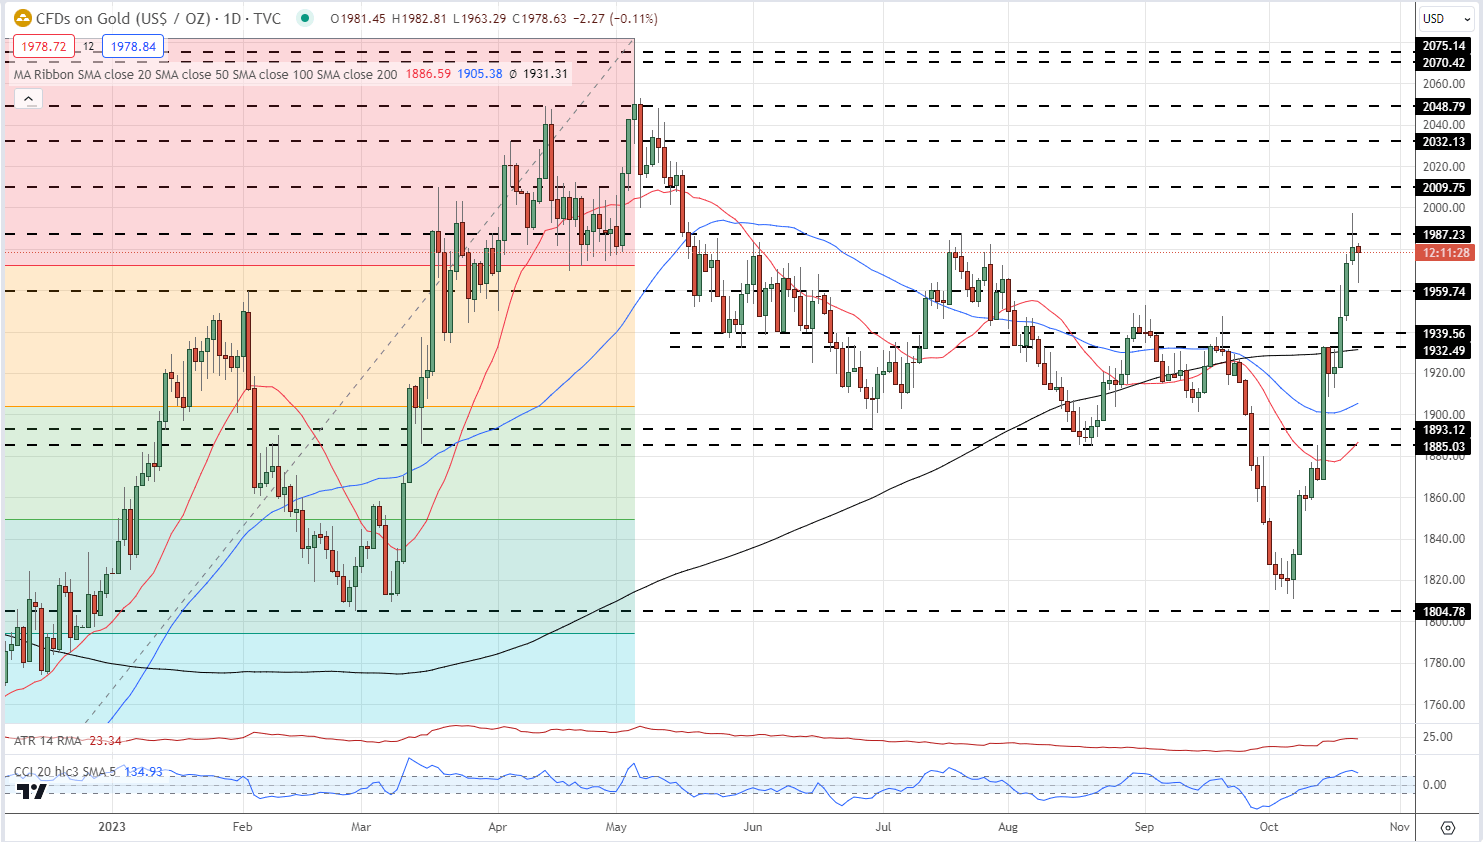
Chart via TradingView
IG Retail Trader data shows 62.75% of traders are net-long with the ratio of traders long to short at 1.68 to 1.The number of traders net-long is 4.47% higher than yesterday and 10.16% lower from last week, while the number of traders net-short is 0.25% higher than yesterday and 23.22% higher from last week. We typically take a contrarian view to crowd sentiment, and the fact traders are net-long suggests Gold prices may continue to fall.
| Change in | Longs | Shorts | OI |
| Daily | 5% | 10% | 7% |
| Weekly | 3% | -3% | 0% |
What is your view on Gold – bullish or bearish?? You can let us know via the form at the end of this piece or you can contact the author via Twitter @nickcawley1.


