


Gold, Silver Weekly Forecast: Bearish
- Risk factors lift gold but the FOMC projections present a massive challenge for gold
- Silver bounces off key Fibonacci level with 200 SMA in focus
- Threat of potential FX intervention by Japanese authorities could pose a threat to gold upside in the coming weeks
- The analysis in this article makes use of chart patterns and key support and resistance levels. For more information visit our comprehensive education library
Risk Factors Lift Gold but the FOMC Projections Present a Massive Challenge
Gold rose at the end of the week, buoyed by a marginally lower US dollar and a hit to risk sentiment which was felt mainly in the US and Europe to a lesser degree. One of the most ambitious strikes lead by United Auto Workers (UAW) got underway on Friday, softening the auto industry, while news that TSMC has asked suppliers to delay deliveries hit the tech-heavy Nasdaq. Another contributor to the unease was North Korean leader Kim Jong Un’s visit to a Russian jet plant as Moscow attempts to gain favour with neighbouring countries as the war against Ukraine drags on.
Gold, a natural safe-haven asset, tends to rise on such news and has done exactly that. However, the recent reprieve may be short-lived as a motivated Fed is due to meet next week. Hotter-than-expected headline inflation in August should be enough for Jerome Powell to stress that the committee stay the course on interest rates. The rise in oil prices had an effect on headline inflation last month – something that is likely to keep the dollar well supported, weighing on gold potentially.

The Fed is due to release its summary of economic projections where the peak in interest rates is likely to suggest one more rate rise before year end but markets will be keenly focused on inflation forecasts given the aggressive rise in oil. Should the Fed, like the ECB, see upside risks to the inflation outlook, further dollar strength is a possible outcome – weighing on gold.
Gold prices end the week with a test of the 200-day simple moving average (SMA), with $1937 the most immediate level of resistance thereafter. On the daily chart on Friday, gold is already showing signs of fatigue at $1930, as was the case a week ago and on Monday. Support comes in at $1915 followed by the swing low at $1901.
Gold (XAU/USD) Daily Chart
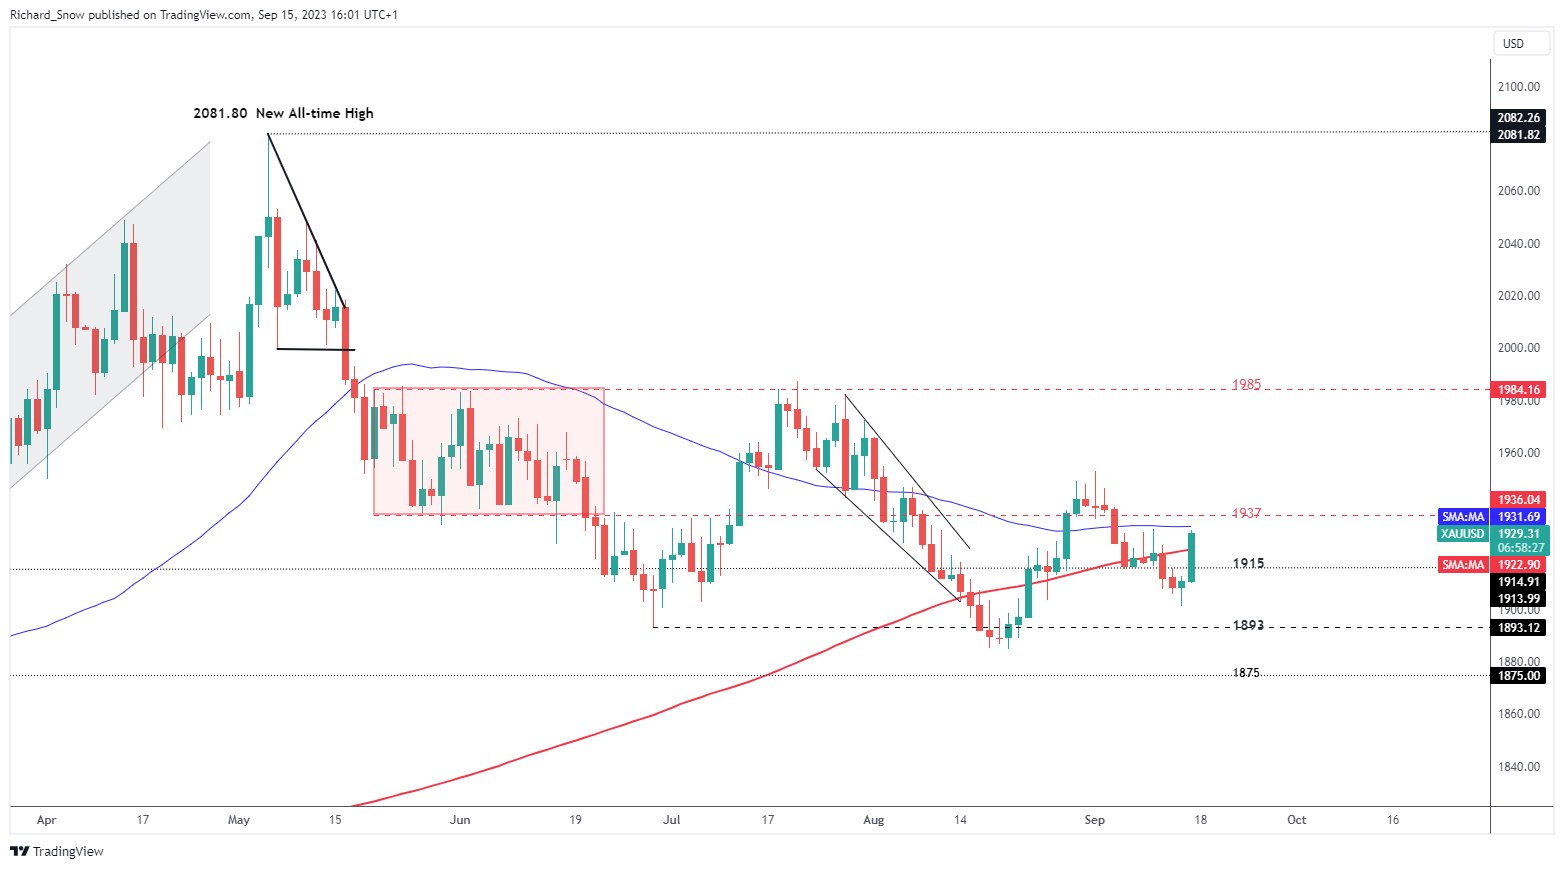
Source: TradingView, prepared by Richard Snow
30-day implied gold volatility suggests that gold is likely to show limited swings in price action. The index continues lower after a prolonged period of congestion.
Gold Volatility Index (GVZ)
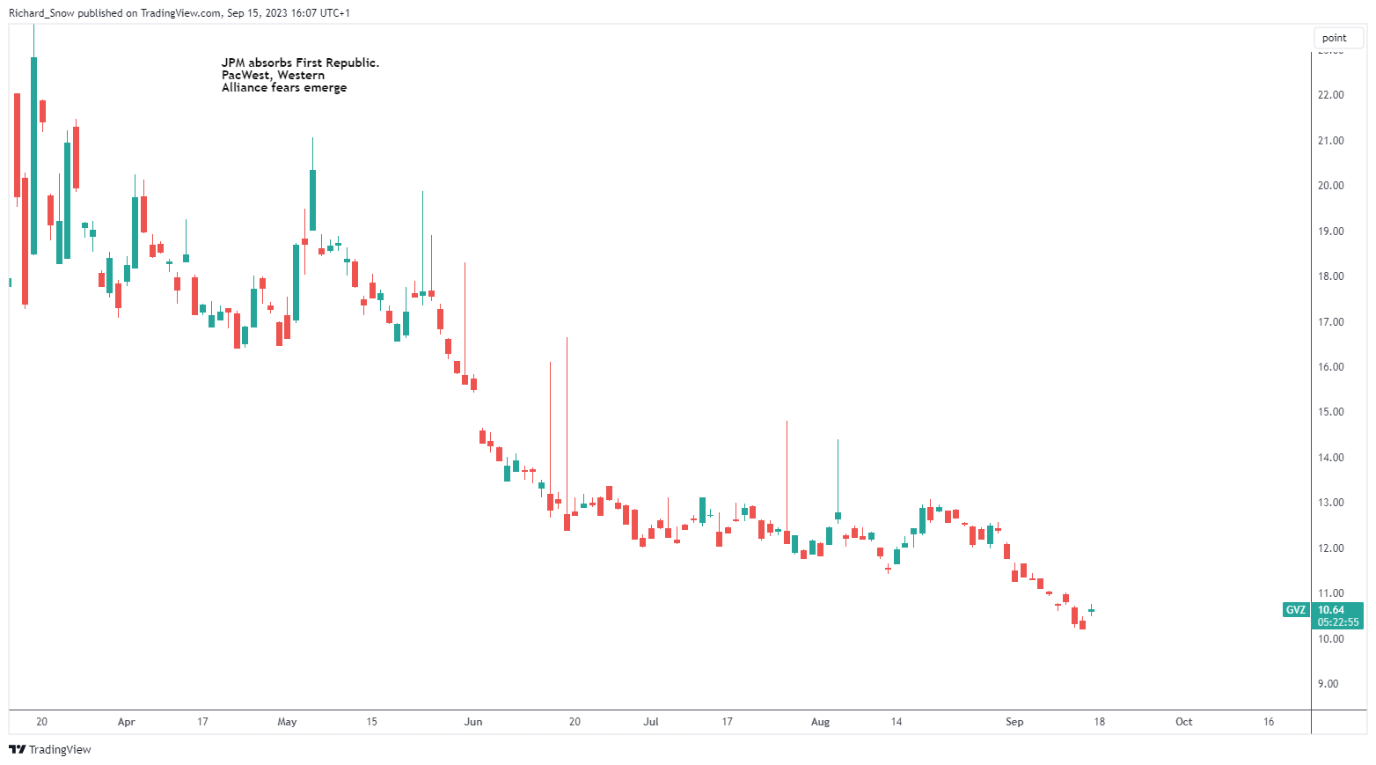
Source: TradingView, prepared by Richard Snow
The weekly gold chart hints at another breach of the descending channel but a weekly close needs to be observed. Last week provided the first break above channel resistance which was almost immediately invalidated as prices cooled notably since then.
Weekly Gold (XAU/USD) Chart
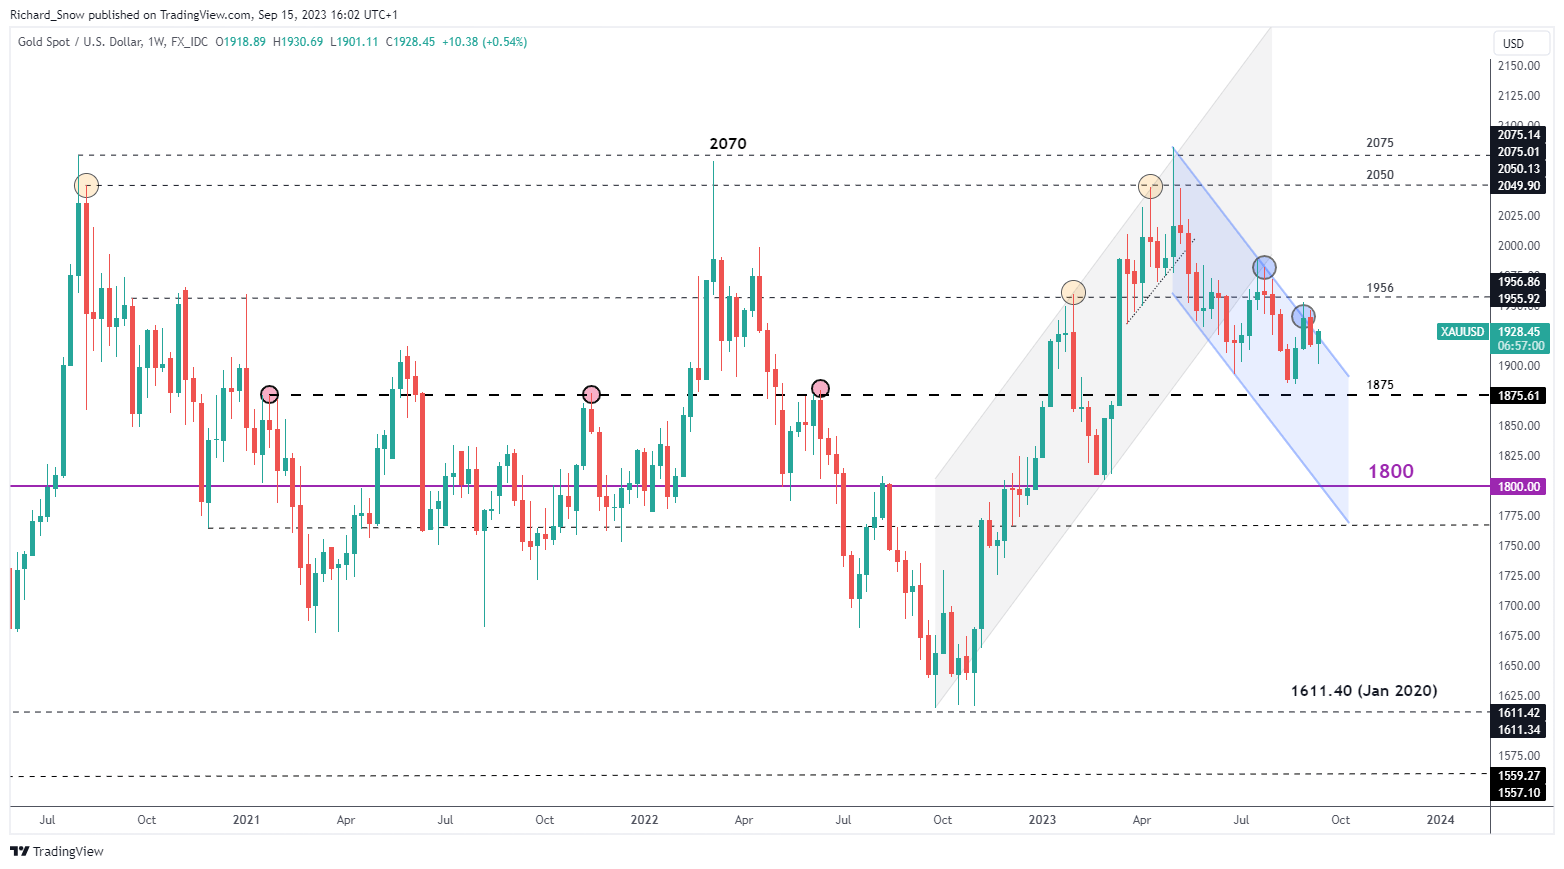
Source: TradingView, prepared by Richard Snow

Japan’s Potential FX Intervention Could Influence Gold Prices via Treasury Yields
US treasury yields (10-year) grinds higher still. Trading around 4.33% at the time of writing, the US 10-year note attempts to reach the yearly high of 4.36% achieved in August. US yields are likely to come under scrutiny soon, particularly if the Japanese Ministry of Finance instructs the Bank of Japan to intervene in the FX market in order to defend the value of the yen. Japan, the world’s largest holder of US debt, may decide to sell treasury securities to acquire dollars and sell those dollars for yen. With bond prices and yields exhibiting a negative correlation, selling US treasuries sends yields higher – potentially posing more of a challenge for the precious metal.
US 10-Year Treasury Note Yield
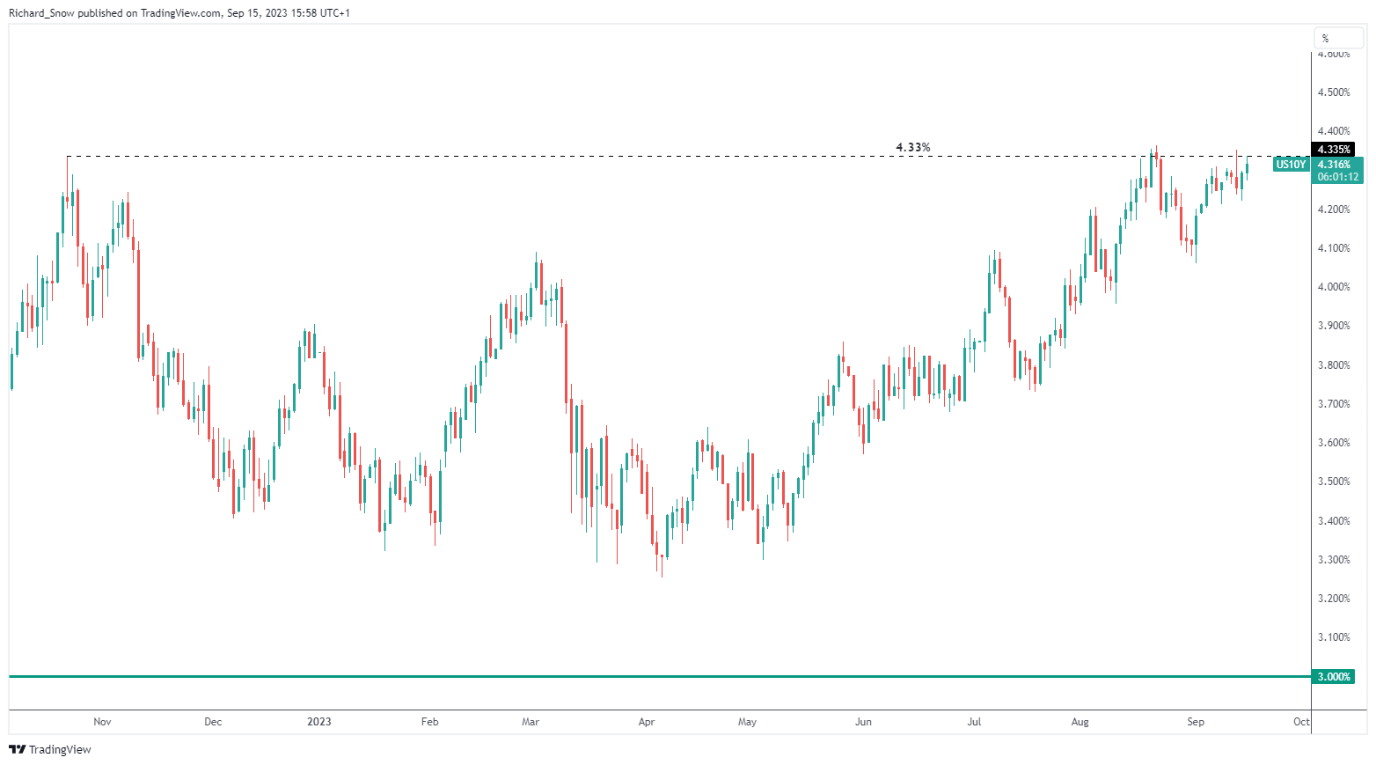
Source: TradingView, prepared by Richard Snow
Silver Bounces off Key Fibonacci Level with 200 SMA in Focus
Silver, like gold, has benefitted from recent risk off dynamics, as the metal reclaims some lost ground. Silver prices found support once again at the 38.2% Fibonacci retracement of the major 2021 to 2022 move at $22.5 before heading higher.
The 200 SMA is also coming into focus for silver but appears a stretch too far as the week draws to a close. With price action below the largely observed trend filter, further selling cannot be discounted but a lot will rest ultimately on the high impact economic events next week, mainly the FOMC press conference and Fed economic projections.
Silver (XAG/USD) Daily Chart
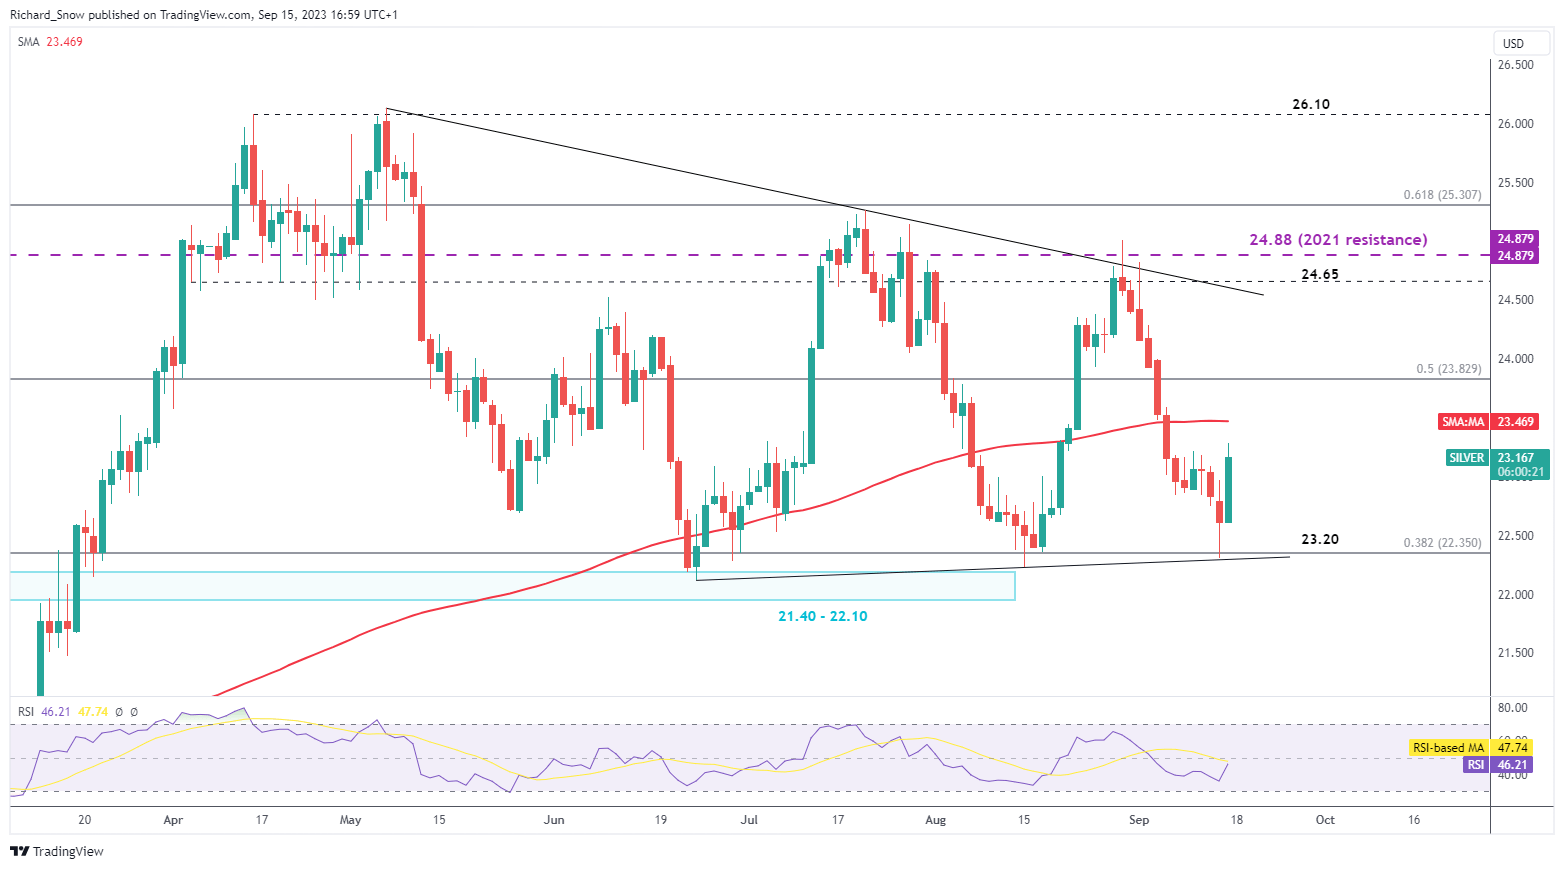
Source: TradingView, prepared by Richard Snow
Trade Smarter - Sign up for the DailyFX Newsletter
Stay up to date with breaking news and market themes
--- Written by Richard Snow for DailyFX.com
Contact and follow Richard on Twitter: @RichardSnowFX


