Most Read: US Dollar Forecast – Bullish Bias Remains in Place, Setups on EUR/USD, USD/JPY
Gold (XAU/USD) rose for the fourth straight session on Tuesday (+0.50% to $2,027), firmly establishing itself above the $2,025 mark, supported by declining U.S. Treasury yields and a subdued U.S. dollar, with risk-averse sentiment on Wall Street likely reinforcing the metal’s advance.
Factoring in recent gains, XAU/USD has risen more than 2% from last week’s lows near $1,985 set in the wake of hotter-than-anticipated U.S. inflation numbers. Despite this positive performance, the Federal Reserve's monetary policy trajectory could cap gold’s upside in the near term, so caution is warranted.
Earlier in 2024, bullion's prospects looked brighter on the assumption that the Fed would deliver aggressive easing measures this year. However, overly dovish expectations have since moderated on account of strong U.S. labor market data and stagnating progress on disinflation.
For an extensive analysis of gold’s fundamental and technical outlook, download our complimentary Q1 trading forecast now!

Traders may further unwind dovish wagers on the FOMC’s path if incoming information continues to reflect economic strength and sticky price pressures. This is because these two factors could push policymakers to delay the start of their easing cycle and diminish the scale of subsequent rate reductions.
There are no major events on the U.S. economic calendar in the coming days, but next week will see the release of January PCE figures. The report is poised to shed light on recent inflation dynamics and offer insights into the Fed's next move, so traders should keep a close eye on it.
Wondering how retail positioning can shape gold prices? Our sentiment guide provides the answers you are looking for—don't miss out, get the guide now!
| Change in | Longs | Shorts | OI |
| Daily | 8% | 9% | 9% |
| Weekly | 2% | -7% | -2% |
GOLD PRICE TECHNICAL ANALYSIS
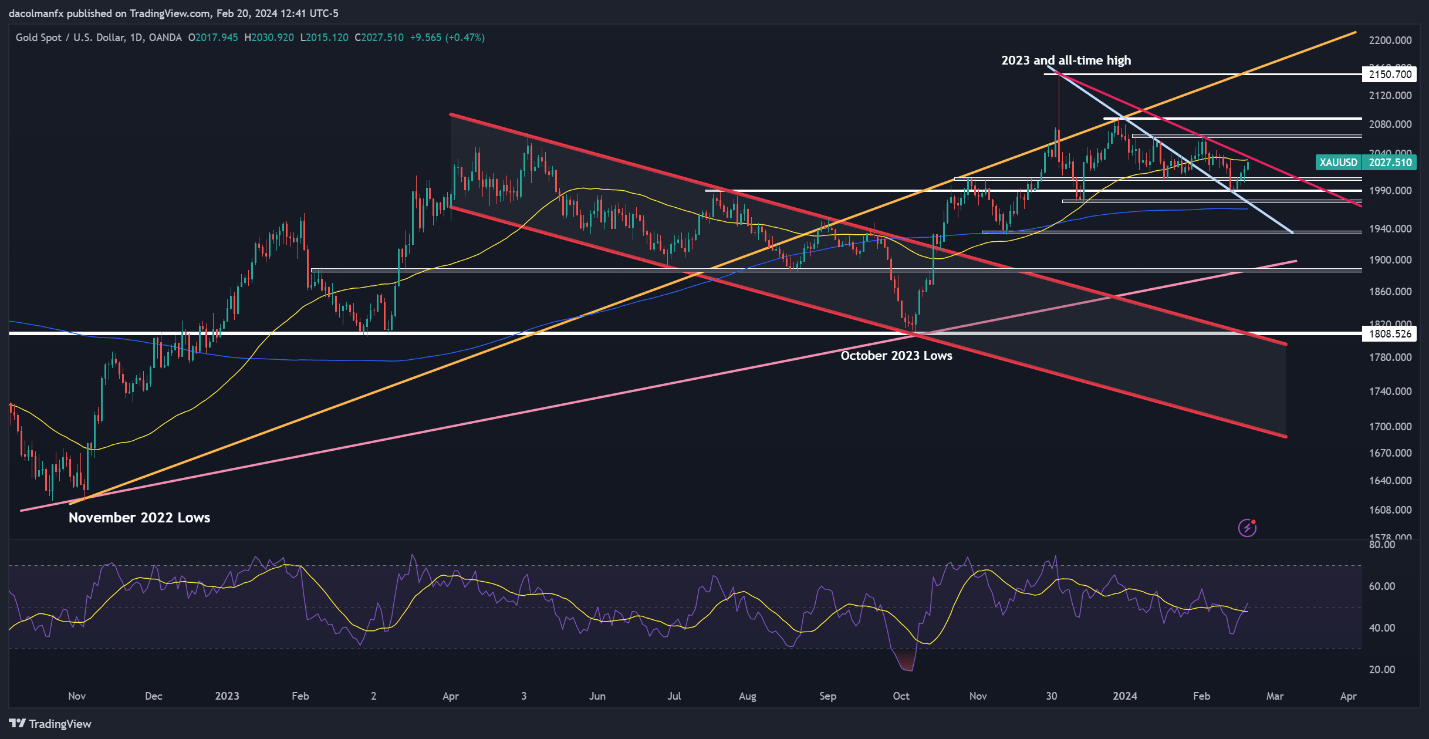
Gold prices extended their recovery on Tuesday, pushing towards confluence resistance near $2,030, where the 50-day simple moving average converges with a descending trendline drawn from last year’s high. If bulls manage to trigger a breakout over the coming trading sessions, a rally toward $2,065 could be around the corner.
On the flip side, if sellers return and spark a bearish reversal off current levels, technical support emerges at $2,005, followed by $1,990. From here onwards, additional losses could result in a pullback towards $1,975. On further weakness, all eyes will be on the 200-day simple moving average.
GOLD PRICE CHART – TECHNICAL ANALYSIS