


Gold, XAU/USD, US Dollar, GC1, Bond Yields, BoE, PBOC, Fed, AUD - Talking Points
- The gold price leaked lower against rising government bond yields
- The PBOC tilted policy and now the BoE moves into view after UK CPI data
- The US Dollar might hold the key for XAU/USD in what is a busy week for markets

The gold price is struggling on Tuesday with the US Dollar currying some favour despite the US being on holiday Monday.
While the main Wall Street indices were closed, the Treasury cash market is open, and yields have managed to tick higher across the curve.
The higher rates of return appeared to underpin the ‘big dollar’ but most other developed market government bond yields also got a boost.
GBP/USD eased today despite 2-year Gilts (UK government bonds) hitting 5% for the first time since 2008. The 5- and 10-year part of the Gilts curve is also eyeing the peaks seen in October last year.
The moves come ahead of CPI data tomorrow and then the Bank of England on Thursday. The interest rate market is anticipating a lift in the official bank rate.
An exception in the government bond market today has been Japanese Government Bonds (JGB). Yields are unmoved there as USD/JPY is eyeing a 7-month peak.
It’s possible that jawboning might start emanating from Bank of Japan officials should its currency continue to depreciate.
Elsewhere, the upshot of US Secretary of State Antony Blinken’s visit to China, which concluded yesterday, was generally seen as progressive although there were no concrete breakthroughs.
The People’s Bank of China (PBOC) cut the 1- and 5-year loan prime rate by 10 basis points to 3.55% and 4.20% respectively.
While the move in the 1-year rate was in line with market expectations, there had been hopes of a 15 basis point downshift in the 5-year rate, where Chinese mortgages are typically priced off.
Trade Smarter - Sign up for the DailyFX Newsletter
Receive timely and compelling market commentary from the DailyFX team
Crude oil prices have eased today with the WTI futures contract near US$ 71 while the Brent contract has dipped under US$ 76. Live prices can be found here.
The Aussie Dollar has clocked the largest losses going into Tuesday after RBA board meeting minutes were released today. They revealed that the members were not as convinced about hiking rates 25 basis points as originally perceived by markets 2 weeks ago.
The RBA’s Statement of Monetary printed immediately after the rate decision appeared to be slightly more hawkish than today’s minutes. Australia’s ASX 200 made some gains on the news.
Looking ahead, the US return from holidays and will see some housing data. The full calendar can be read here.
Fed Chair Jerome Powell will be giving his Semi-annual Monetary Policy Report to Congress on Wednesday.
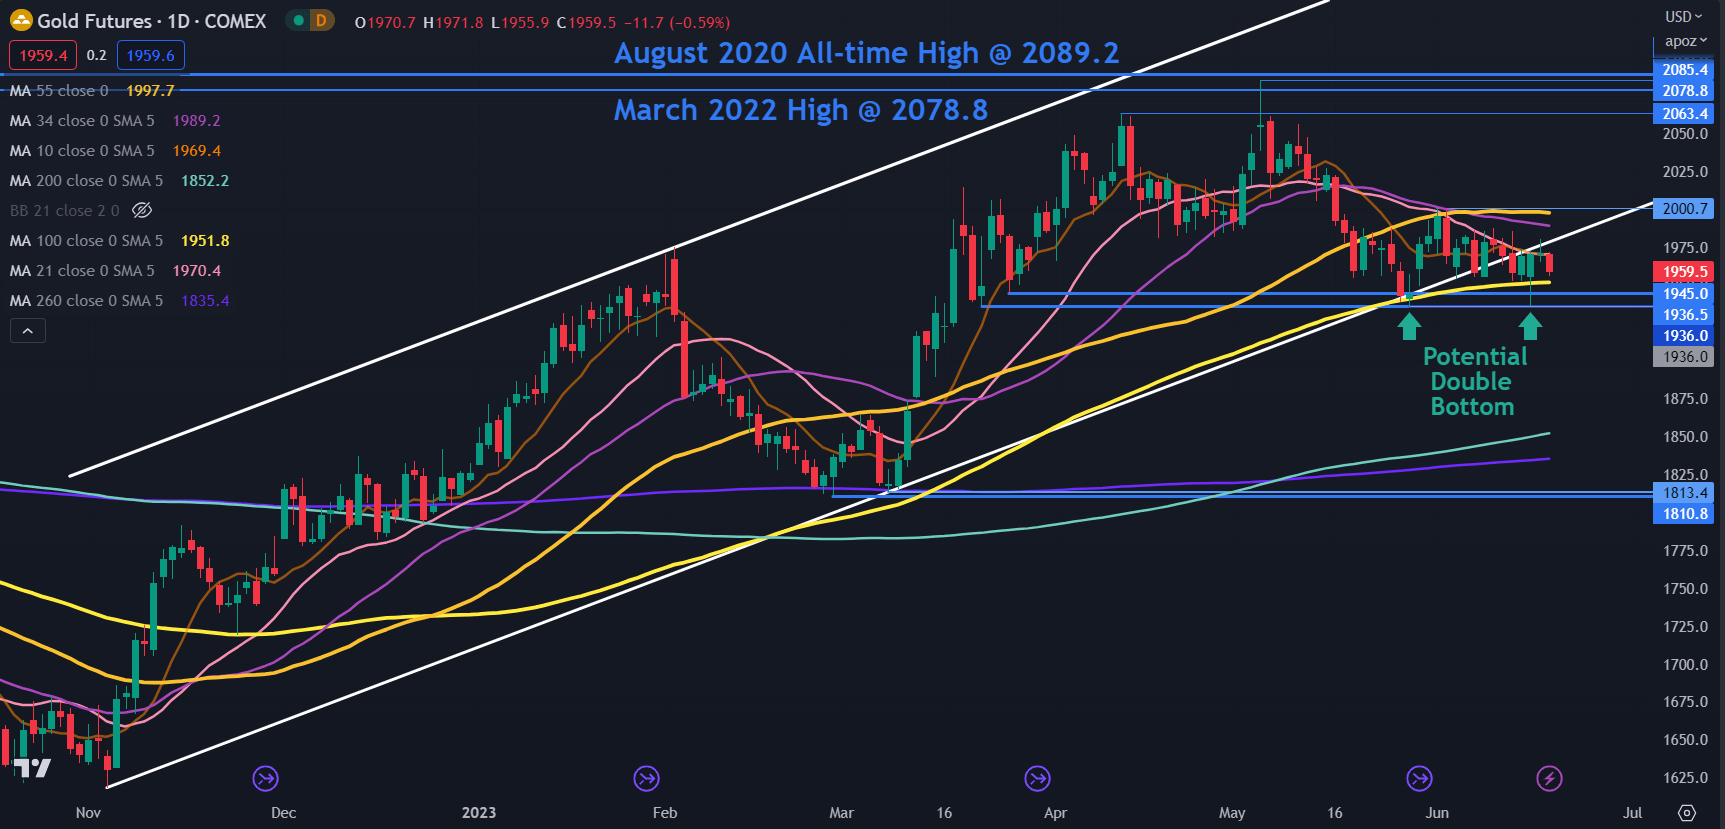
GC1 (GOLD FRONT FUTURES CONTRACT) TECHNICAL ANALYSIS
Gold’s recent dip below an ascending trend line has not been a convincing break. Support levels in the 1936 – 1945 area have held so far and might continue to do so.
Last Thursday’s low of 1936 has set up a potential Double Bottom that coincides with a previous low. The potential Double Bottom could be confirmed should it move above the neckline at 2000.
The push lower went under the 100-day Simple Moving Average (SMA) but the daily close was back above it.
This may suggest that recent bearishness could have been rejected by the market for now.
A clean break below that area may see a bearish run evolve, and the next support zone of note could be at the next Double Bottom of 1811 and 1813.
CTA BANNER HERE
If gold gets above the 55-day SMA, currently sitting just under 2000, it will be above all period daily SMAs, which may suggest that bullish momentum is evolving.
If it does break above 2000, it could run for a potential resistance zone ahead of the all-time high.
The early May high of 2085 eclipsed the March 2022 peak of 2079 but was unable to overcome the all-time high of 2089. This failure to break new ground to the upside has created a Triple Top which is an extension of a Double Top formation.
This has set up a potential resistance zone in the 2080 – 2090 area but a snap above those levels may indicate further unfolding bullishness.

--- Written by Daniel McCarthy, Strategist for DailyFX.com
Please contact Daniel via @DanMcCathyFX on Twitter


