


Gold, XAU/USD, US Dollar, DXY Index, Fed, FOMC, Real Yields, Data - Talking Points
- The gold price appears hostage to sways in the US Dollar for now
- Market movements might be vulnerable to data points this week
- With the Fed in a blackout period, US real yields may play a role

The gold price has paused on its recent run higher as the market takes stock of where the US Dollar is headed. The yellow metal has eased to start the week as the ‘big dollar’ ticks slightly higher.
Soft inflation data in the US last week saw the market reappraise the extent of tightening that the Federal Reserve will need to carry out in order to contain price pressures.
With CPI and PPI sliding lower, Treasury yields have backed away from their recent peaks.
The benchmark 10-year note he is currently trading near 3.8% after having nudged up against 4.1% just over a week ago. The 2-year bond made a 17-year high earlier this month above 5.1% but it is now back below 4.8%.
The DXY index lost close to 2.25% last week while the gold futures contract only added 1.65%. The index moved to its lowest level since April 2022.
Interest rate markets have placed a high probability of a 25 basis point lift in the overnight target rate when the Federal Open Market Committee (FOMC) gather on July 26th.
With the Fed now in a blackout period ahead of its meeting, the data points in the week ahead could drive market volatility.
The market will see a number of business sentiment surveys as well as retail sales, industrial production, housing market statistics and jobs data. The full calendar can be read here.
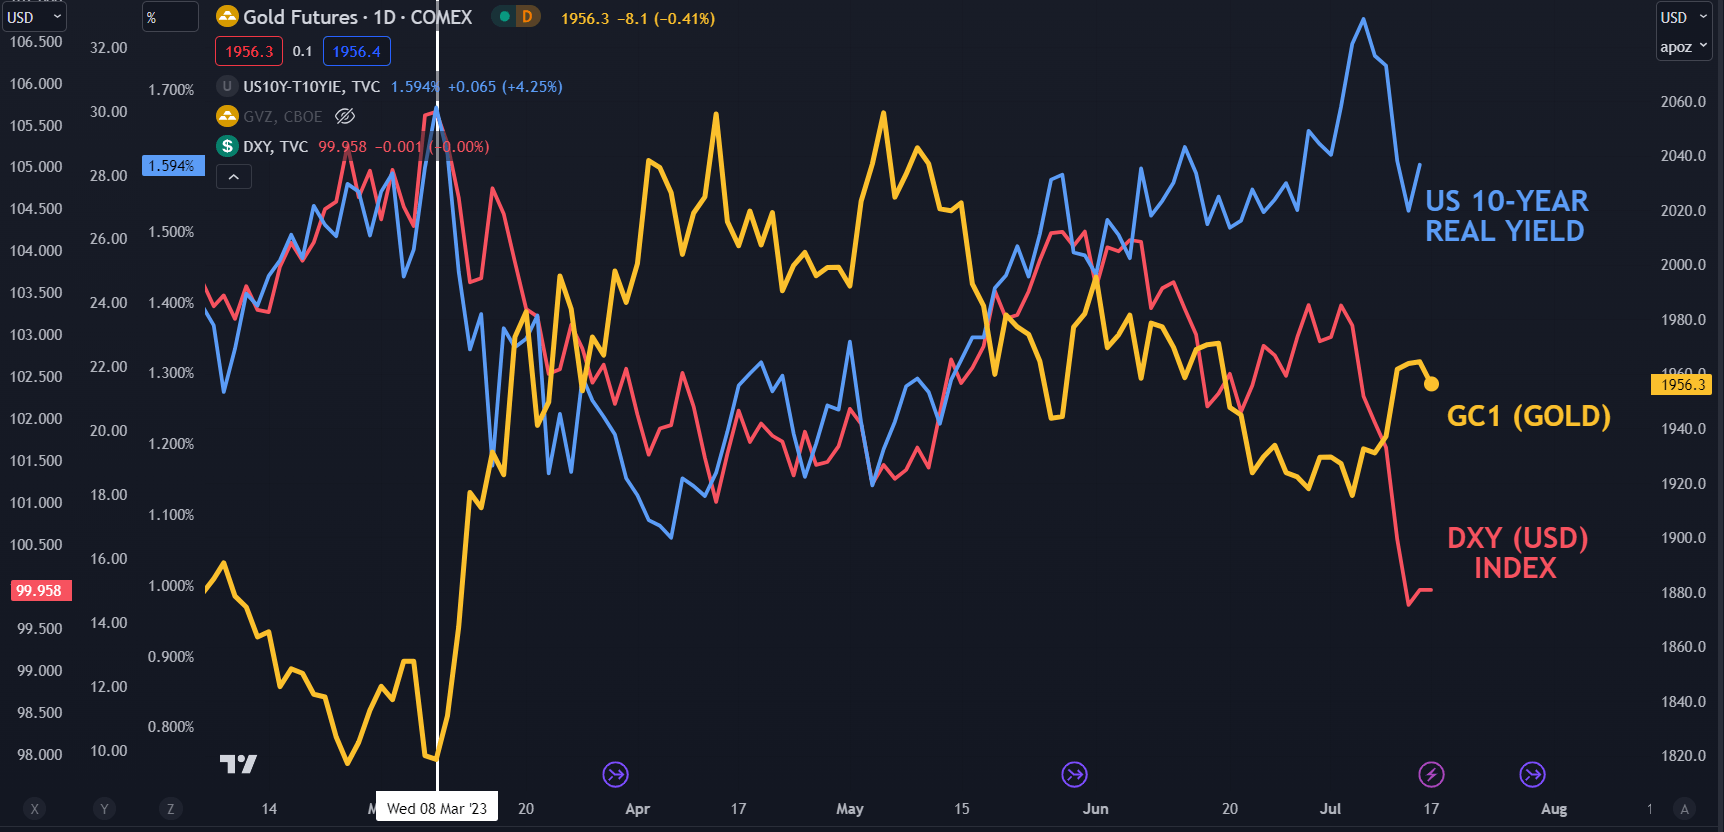
Something else to keep an eye on might be the US real yield. The inflation-adjusted return from the 10-year part of the curve sometimes has a strong correlation to gold.

GC1 (GOLD FRONT FUTURES CONTRACT) AGAINST US 10-YEAR REAL YIELD AND DXY (USD) INDEX
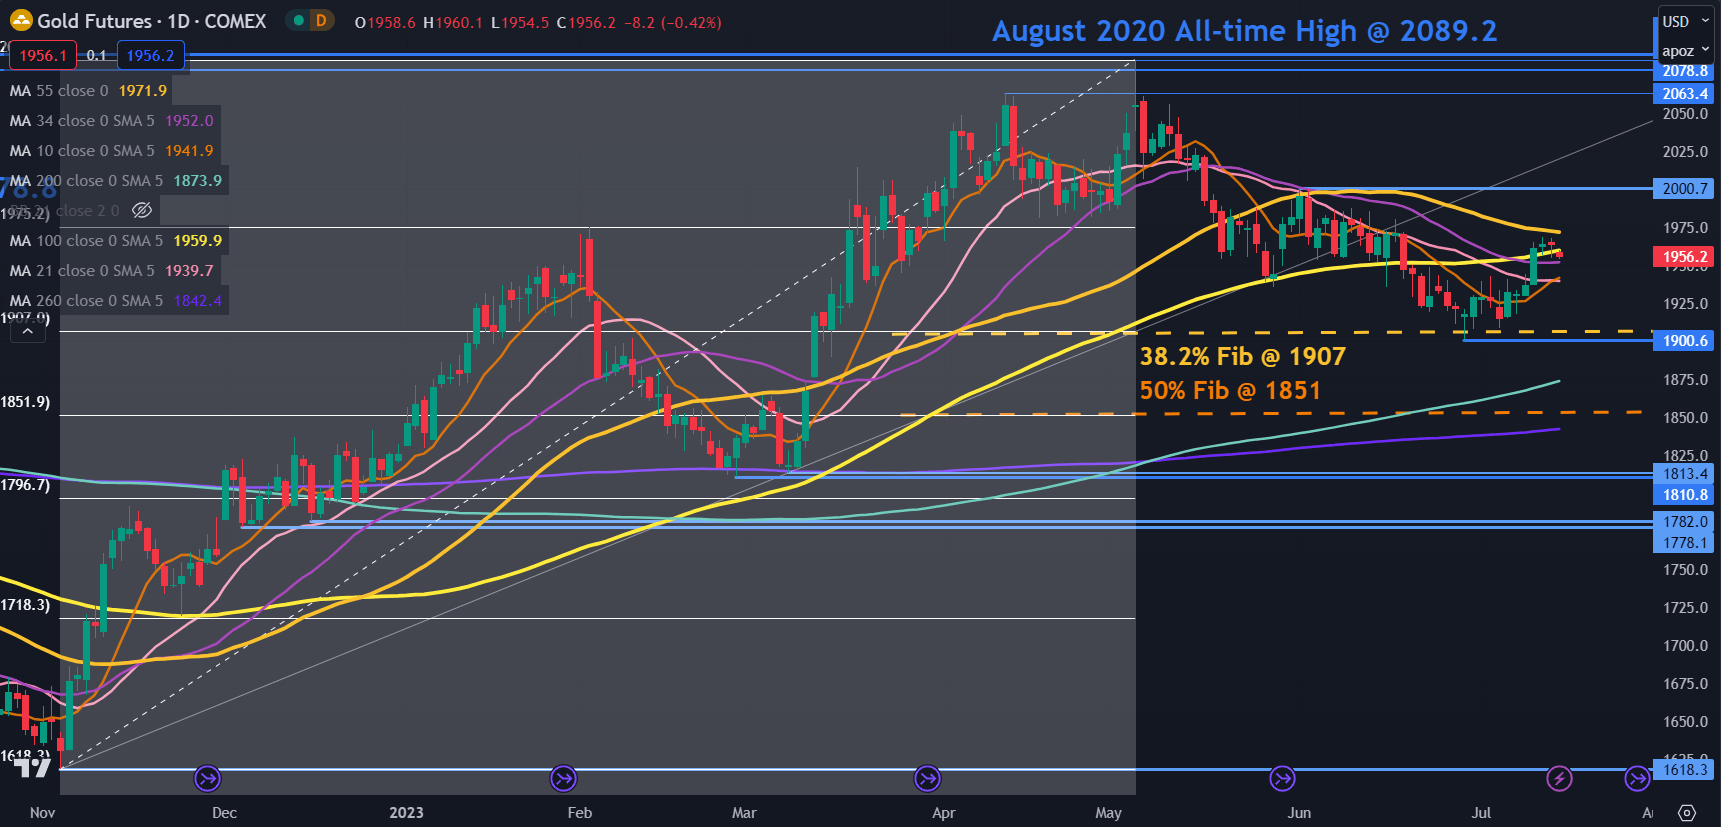
GC1 (GOLD FUTURES) TECHNICAL ANALYSIS
The gold price remains in the middle of its 2-month range between 1900 and 2000.
The lower bound of the range could see support lie at the Fibonacci Retracement levels of the move from 1618 up to 2085. The 38.2% retracement level is at 1907 and the 50% at 1851. The recent low 1900 might also see some support.
Looking at momentum, the price has moved above the 10-, 21-, 34-, 100, 200- and 260-day simple moving averages (SMA).
The 55-day SMA is currently within striking distance of the price at 1972. A clean break above the last remaining daily SMA might see bullish momentum evolve.
The peak of 2000 may offer resistance ahead of a potential resistance zone in the 2060 – 2090 area.
--- Written by Daniel McCarthy, Strategist for DailyFX.com
Please contact Daniel via @DanMcCathyFX on Twitter


