


GOLD OUTLOOK & ANALYSIS
- US inflationary pressures keep gold price subdued.
- Spotlight on US PPI, jobless claims and retail sales.
- Gold bears seek out $1900 support handle.

XAU/USD FUNDAMENTAL BACKDROP
Gold prices remain under pressure this Thursday after yesterday’s US CPI report showed elevated headline inflation despite a softer core inflation read. This translates through to sustained tight monetary policy by the Federal Reserve. Energy was the primary contributor to the higher headline figure and with crude oil prices expected to remain buoyant, the ‘higher for longer’ narrative is gaining traction. There may not be any additional rate hikes but rate cuts could be pushed back. If we look at money market pricing below, markets expect a rate cut around June 2024 but with data dependency holding sway over the Fed, this could easily change.
IMPLIED FED FUNDS FUTURES
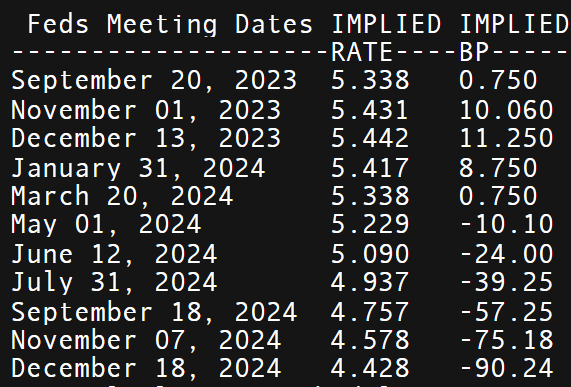
Source: Refinitiv
Later today, gold traders will look to US PPI, jobless claims and retail sales (see economic calendar below) for guidance. Initial jobless claims has been on a downward trajectory recently thus highlighting the robust US labor market and adding to hawkish bets. Should this be the case alongside higher PPI, gold could breakdown further. It is important to remember that PPI is known as a leading indicator for CPI as a rise in producer costs tend to transfer over to the consumer.
GOLD ECONOMIC CALENDAR
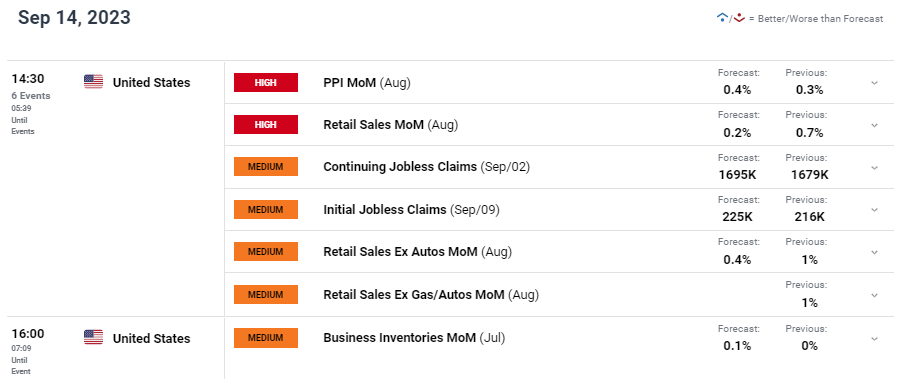
Source: DailyFX
Trade Smarter - Sign up for the DailyFX Newsletter
Receive timely and compelling market commentary from the DailyFX team
TECHNICAL ANALYSIS
GOLD PRICE DAILY CHART
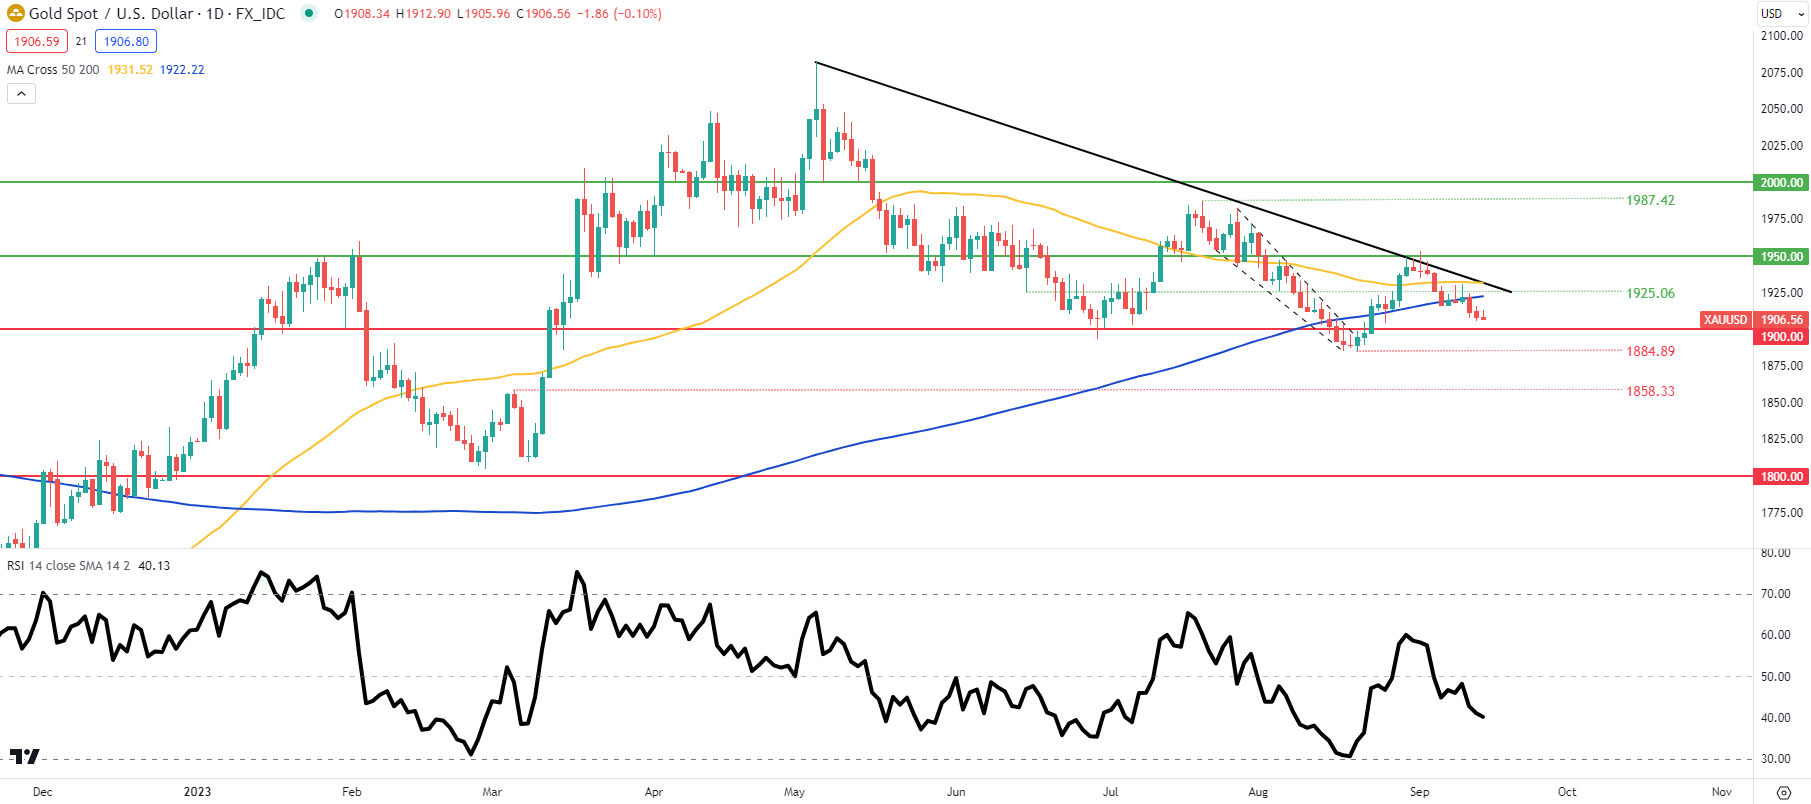
Chart prepared by Warren Venketas, IG
Daily XAU/USD price action is now trading below both the 50-day and 200-day (blue) moving averages respectively. This bearish momentum (augmented by the Relative Strength Index (RSI)) brings into consideration the 1900.00 psychological support level. Strong US data and sticky PPI numbers could result in a retest of this support zone.
Resistance levels:
- 1950.00
- 50-day MA (yellow)
- 1925.06/Trendline resistance
- 200-day MA
Support levels:
- 1900.00
- 1884.89
IG CLIENT SENTIMENT: MIXED
IGCS shows retail traders are currently distinctly LONG on gold, with 74% of traders currently holding long positions (as of this writing). Download the latest sentiment guide (below) to see how daily and weekly positional changes affect GOLD sentiment and outlook.
Introduction to Technical Analysis
Market Sentiment
Recommended by Warren Venketas
Contact and followWarrenon Twitter:@WVenketas


