


RAND TALKING POINTS & ANALYSIS
- US holiday places emphasis on SA factors.
- SA PMI & GDP in focus tomorrow.
- Rising wedge indicative of bearish continuation.
Trade Smarter - Sign up for the DailyFX Newsletter
Receive timely and compelling market commentary from the DailyFX team
USD/ZAR FUNDAMENTAL BACKDROP
The rand is giving back last Friday’s gains against the USD with the US & Canadian markets observing Labor Day. Liquidity will likely be relatively thin today but with local energy constraints (loadshedding) worsening, the rand is being negatively influenced. In addition, moderating South African inflationary pressures (both CPI and PPI) could point to the South African Reserve Bank (SARB) cutting interest rates sooner than expected should this trend continue.
On the commodity front, many South African specific commodity exports are trading lower despite a weaker Dollar Index (DXY).
With no economic data scheduled for today, the week ahead (see economic calendar below) will focus on South African PMI data and the Q2 GDP report.
From a US perspective, markets are still digesting last weeks mixed Non-Farm Payroll (NFP) figures alongside a stronger ISM Manufacturing PMI release. ISM Services later this week will carry more weight with the US being primarily services driven and because estimates slightly lower, the greenback may be weighed down if actual data falls in line.
ZAR ECONOMIC CALENDAR (GMT +02:00)

Source: DailyFX Economic Calendar
Introduction to Technical Analysis
Candlestick Patterns
Recommended by Warren Venketas
TECHNICAL ANALYSIS
USD/ZAR DAILY CHART
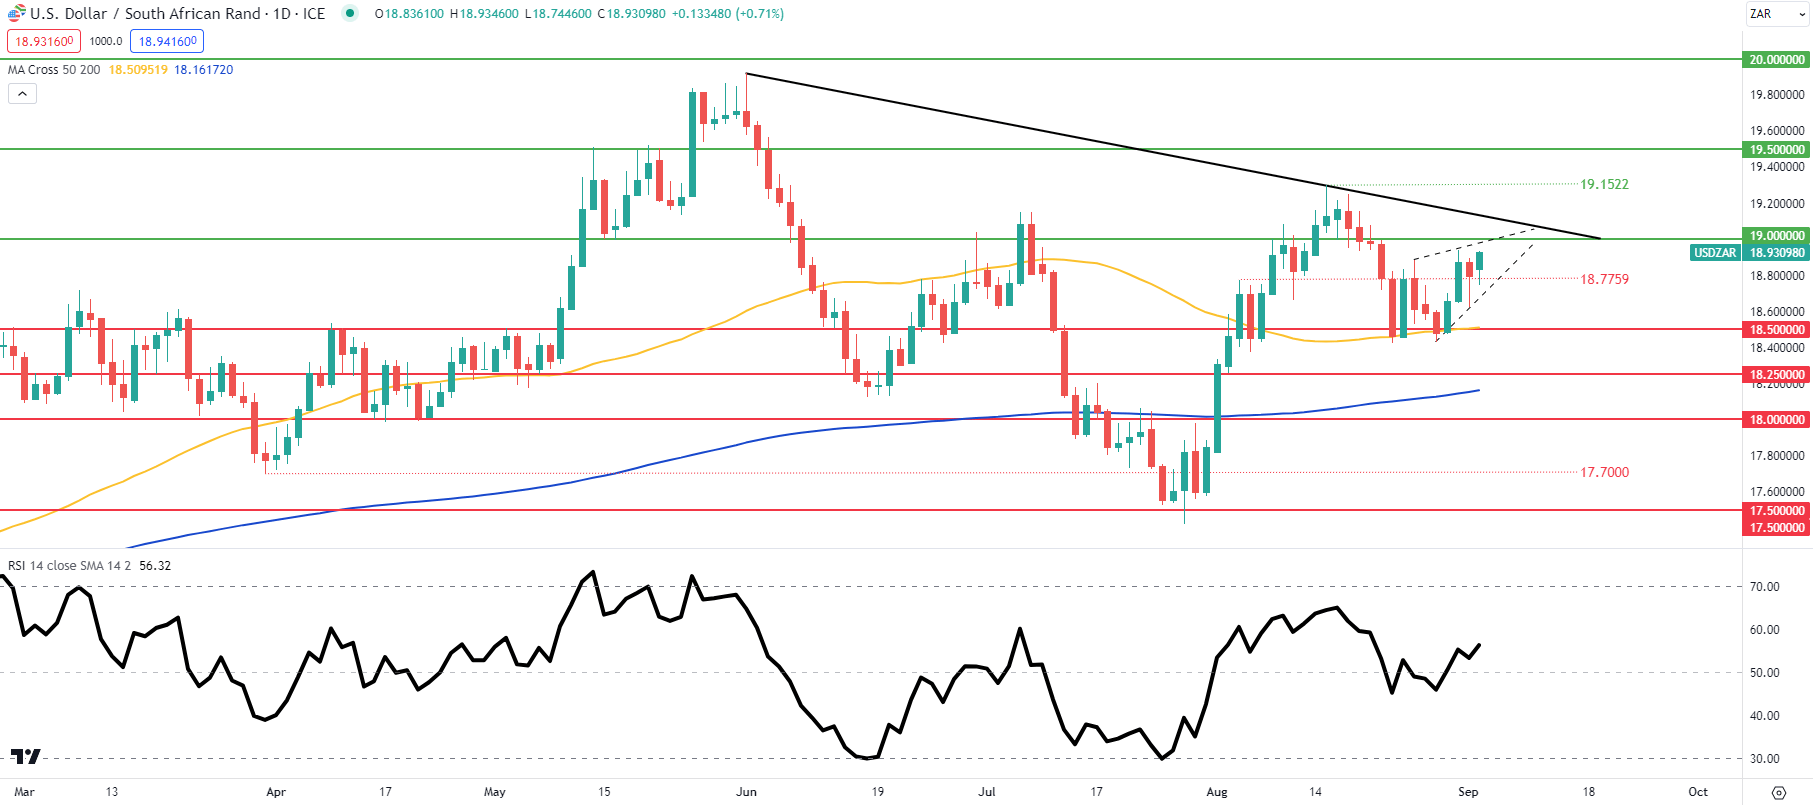
Chart prepared by Warren Venketas, IG
Daily USD/ZAR price action looks to be trading within a rising wedge chart pattern (dashed black line) which could suggest impending downside to come. That being said, there is still room for bulls to drive prices towards trendline resistance (black) coinciding with the 19.0000 psychological handle before a breakout lower is confirmed. From a bullish perspective, the pattern could be invalidated should we see a daily candle close above trendline resistance.
Resistance levels:
- 19.1522
- Trendline resistance
- 19.0000
Support levels:
- Wedge support
- 18.7759
- 18.5000/50-day MA (yellow)
Contact and followWarrenon Twitter:@WVenketas


