
USD/JPY OUTLOOK:
- USD/JPY jumps after U.S. PMI data surprises to the upside
- Strong economic activity boosts Treasury yields across the curve, reviving expectations for “higher-for-longer” interest rates
- S&P Global Composite PMI clocks in at 53.5 versus 52.3 in March, a sign business activity may be starting to rebound

Most Read: Sterling Price Outlook - Signs of Bullish Impetus Reverse Ahead of a Busy Week
USD/JPY was losing ground early Friday morning, but took a 180-degree turn and reversed sharply higher shortly after U.S. markets opened, supported by better-than-anticipated U.S. economic data. The chart below shows how the pair jumped from 133.55 to 134.35 in a matter of minutes.
USD/JPY 5-MINUTE CHART
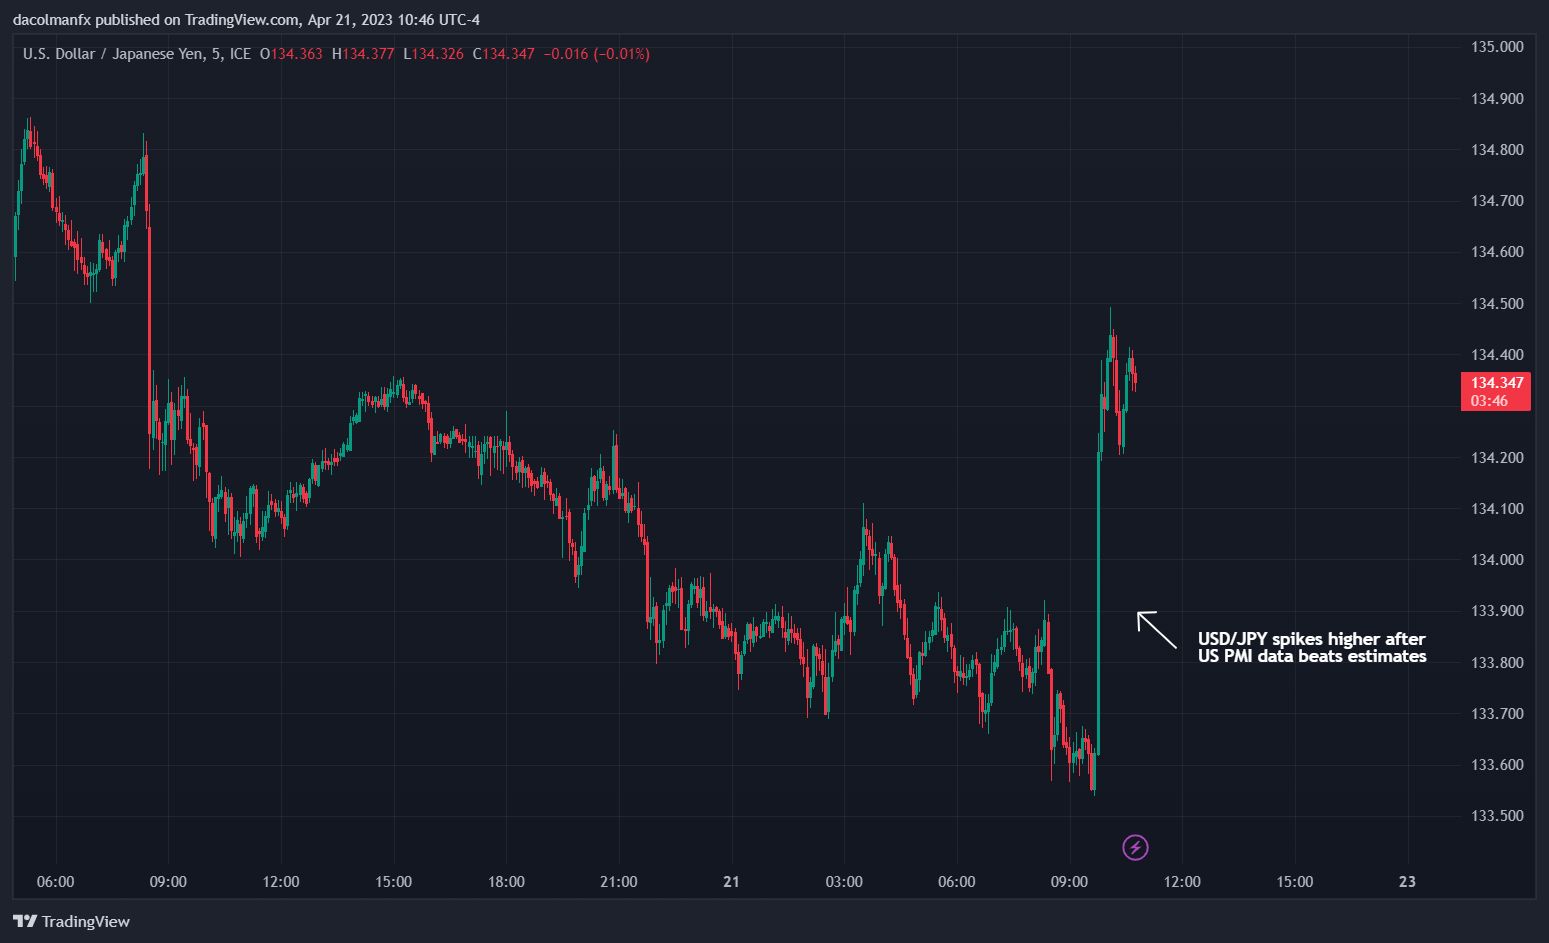
Source: TradingView
For context, S&P Global Flash U.S. Composite PMI clocked in at 53.5 in April from 52.3 previously, with services business activity surging to 53.7 from 52.6 and manufacturing production climbing to 50.4 from 49.2 one month ago. Both PMI subindices surprised to the upside relative to consensus estimates.
US ECONOMIC CALENDAR
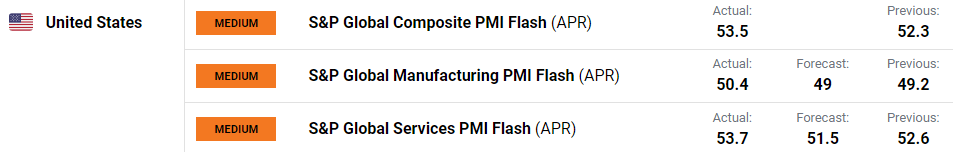
Source: DailyFX
Resilient macro results bolstered U.S. Treasury rates, especially those at the front end of the curve, as traders repriced the FOMC monetary policy path a little higher compared to the previous day, as reflected in the chart below, which displays several 2023 Fed funds futures contracts with their respective implied yields trending in an upward direction.

2023 FED FUNDS FUTURES
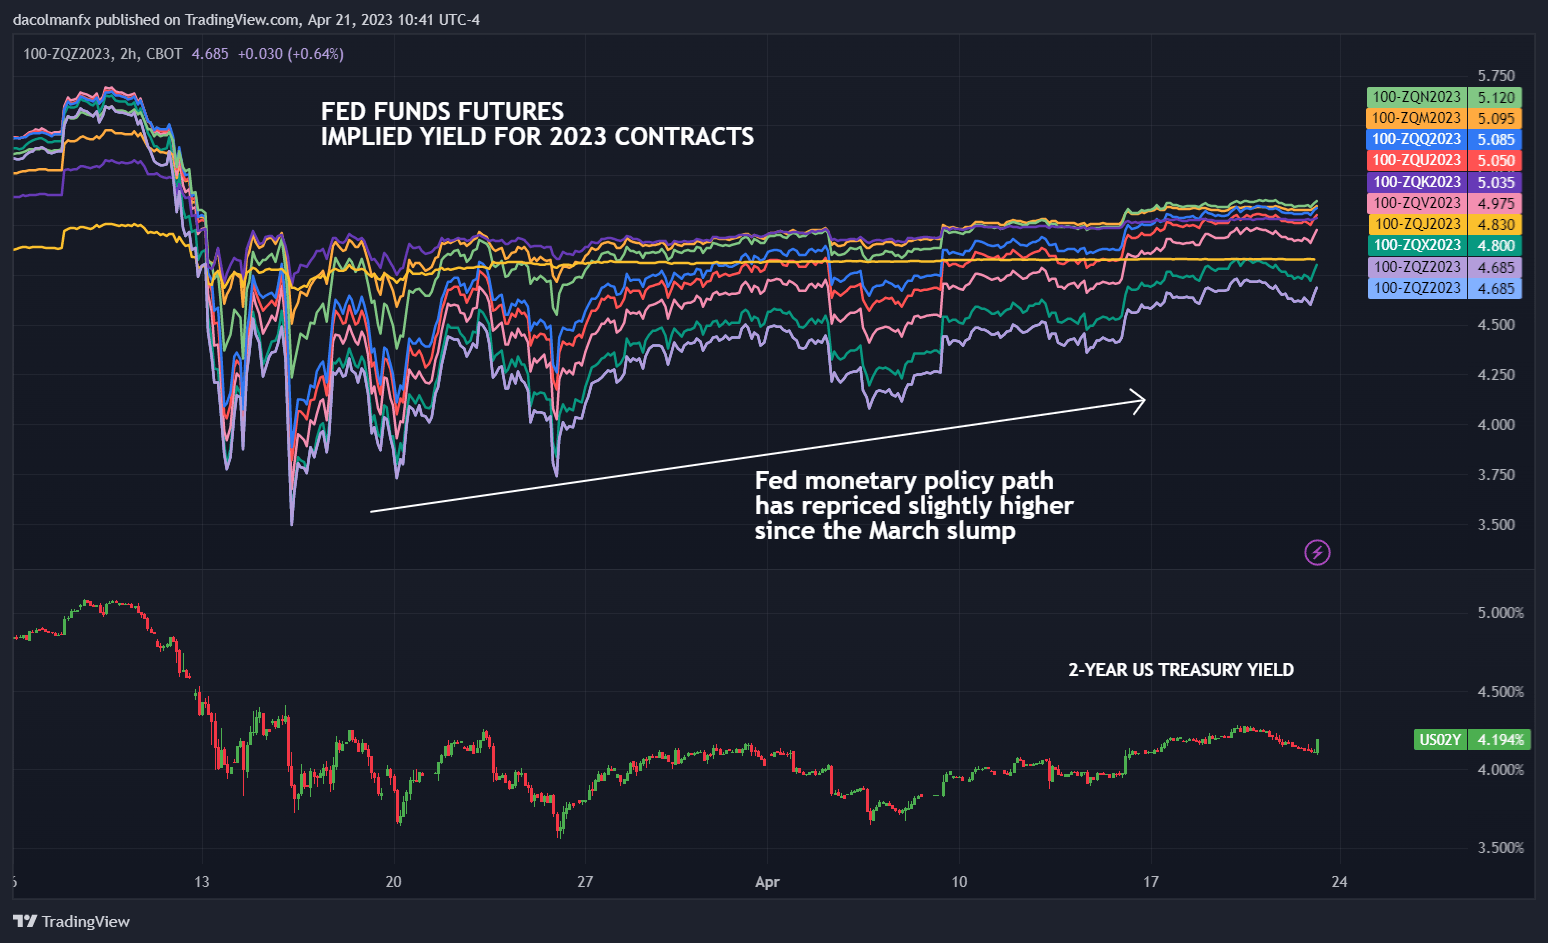
Source: TradingView
The strong performance of the U.S. economy despite numerous headwinds signals that the country may be able to avoid a hard landing and that inflation will stay elevated for longer. This, in turn, could preclude the Fed from cutting rates too soon. While the outlook is fluid and subject to unexpected changes, the stars seem to be aligning for some U.S. dollar strength, at least in the near term.
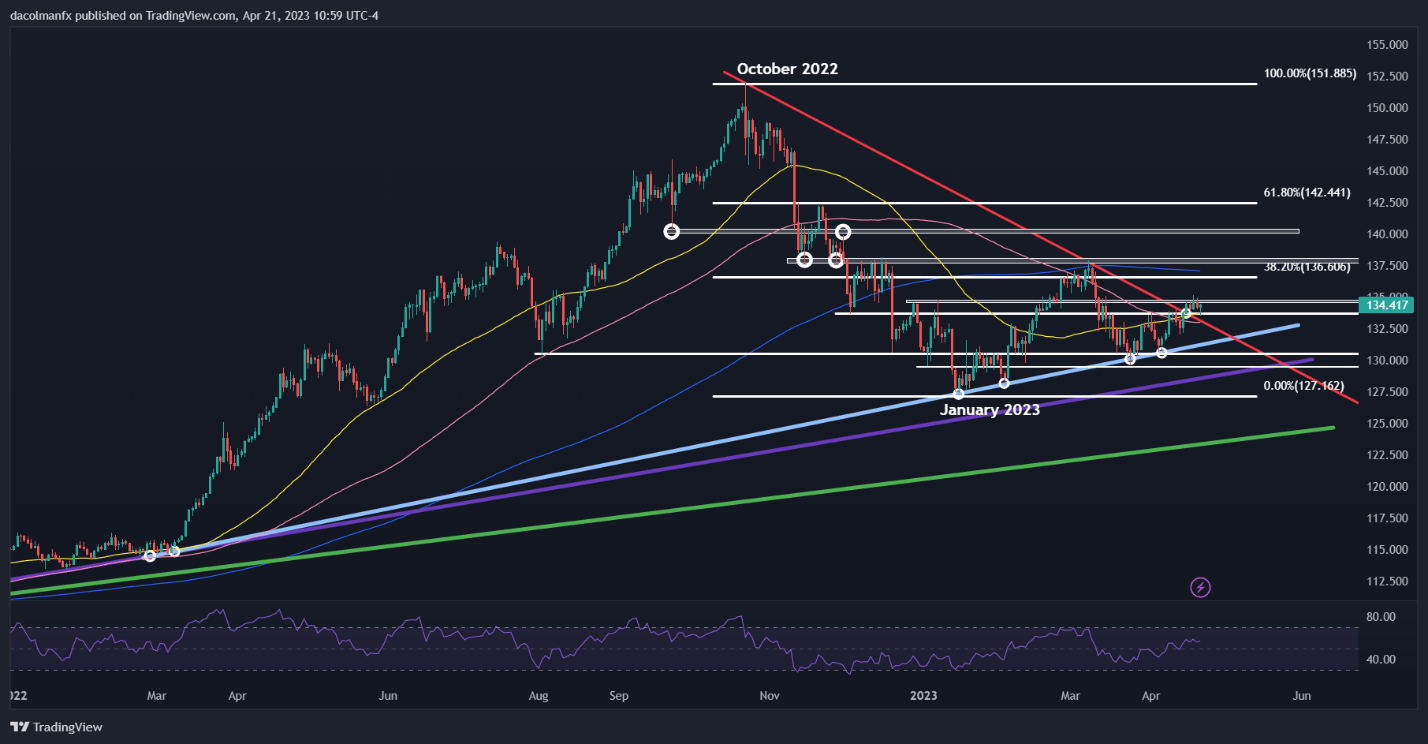
In the current environment, USD/JPY will have fewer obstacles to extending its recent rebound, with initial resistance seen at 134.75, followed by 136.60, the 38.2% Fib retracement of the Oct 2022/Jan 2023 decline. In case of a pullback, the first support to consider appears at 133.75/133.65, and 131.50 thereafter.
| Change in | Longs | Shorts | OI |
| Daily | 52% | -16% | -1% |
| Weekly | 104% | -36% | -17% |
USD/JPY TECHNICAL CHART