
US DOLLAR, EUR/USD, GBP/USD, NASDAQ 100 FORECAST
- U.S. dollar softens amid mixed Treasury yields ahead of key U.S. inflation data on Thursday
- The Nasdaq 100, meanwhile, treks upwards but the move lacks strong conviction, with traders avoiding large directional positions before assessing the next CPI report
- This article focuses on the technical outlook for EUR/USD, GBP/USD and the Nasdaq 100
Trade Smarter - Sign up for the DailyFX Newsletter
Receive timely and compelling market commentary from the DailyFX team
Most Read: Gold Price and USD/JPY Forecast - US Inflation Outcome to Drive Market Direction
The U.S. dollar was somewhat subdued on Wednesday, displaying weakness against some currencies and strength against others, in a context of mixed Treasury yields ahead of high-impact market events later in the week, including the release of the December CPI and PPI surveys.
Tech stocks, meanwhile, traded slightly higher, with the Nasdaq 100 up 0.37% on the session. Although Wall Street’s mood has been positive of late, traders have been reluctant to deploy additional capital into risk assets before assessing the upcoming inflation report, which could guide the Fed’s next steps in terms of monetary policy.
Market performance
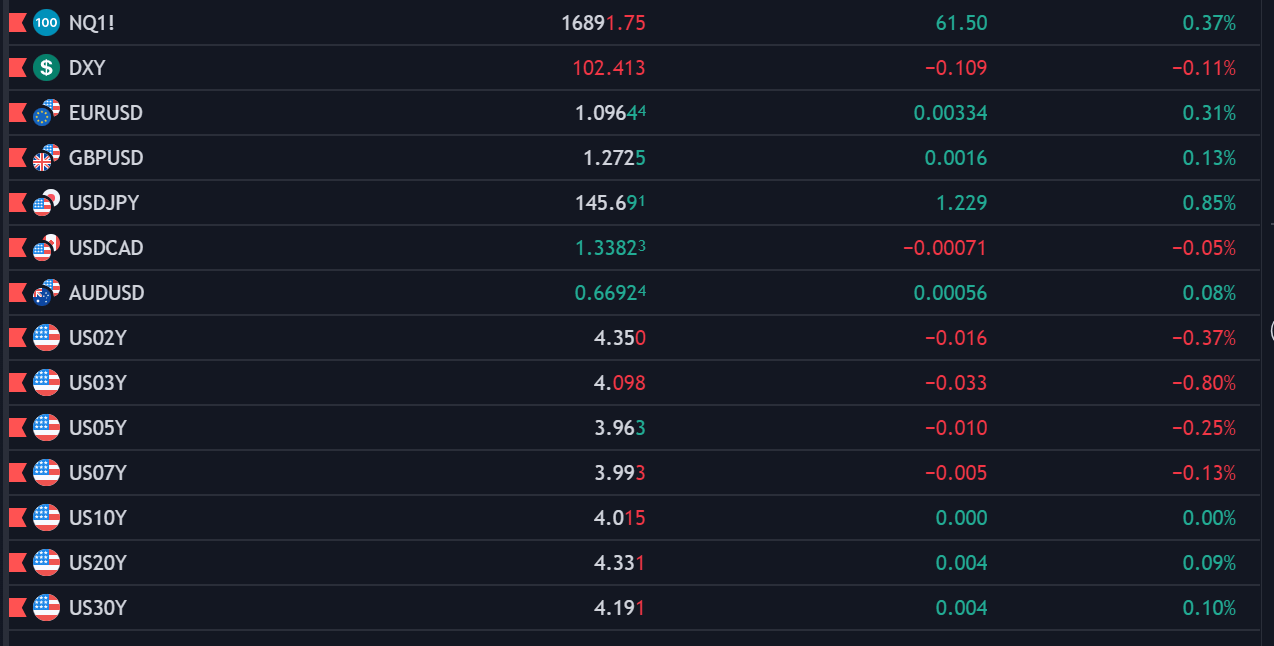
Source: TradingView
While annual core CPI is expected to have moderated last month, the all-items indicator is forecast to have reaccelerated, climbing from 3.1% y-o-y to 3.2% y-o-y, an unwelcomed development for the U.S. central bank that is bound to have a negative impact on public opinion and market sentiment in the near term.
For stocks to receive the green light to rally and for the U.S. dollar to resume its decline, incoming inflation data needs to show compelling evidence of the U.S. economy making further progress toward price stability. Absent this progress, interest rate expectations could reprice in a hawkish direction, sending yields on a tear. This scenario would benefit the greenback but hurt stocks.
Upcoming US Inflation Report

Source: DailyFX Economic Calendar
Interested in learning how retail positioning can offer clues about EUR/USD’s near-term trajectory? Our sentiment guide has valuable insights about this topic. Download it now!
| Change in | Longs | Shorts | OI |
| Daily | 5% | 8% | 6% |
| Weekly | -17% | 16% | -2% |
EUR/USD TECHNICAL ANALYSIS
EUR/USD experienced a downward correction from late December to early January but found stability and rebounded after colliding against channel support around 1.0875. If the rebound picks up pace in the coming trading sessions, overhead resistance is located at 1.1020. On further strength, the focus shifts to 1.1075/1.1095, followed by 1.1140.
On the other hand, if sellers re-enter the market and drive the exchange rate lower, the first technical floor to watch emerges at 1.0930 and then 1.0890. Bulls need to defend this zone diligently; failure to do so might prompt a retracement towards the 200-day simple moving average, followed by a descent towards the 1.0770 area.
EUR/USD TECHNICAL CHART
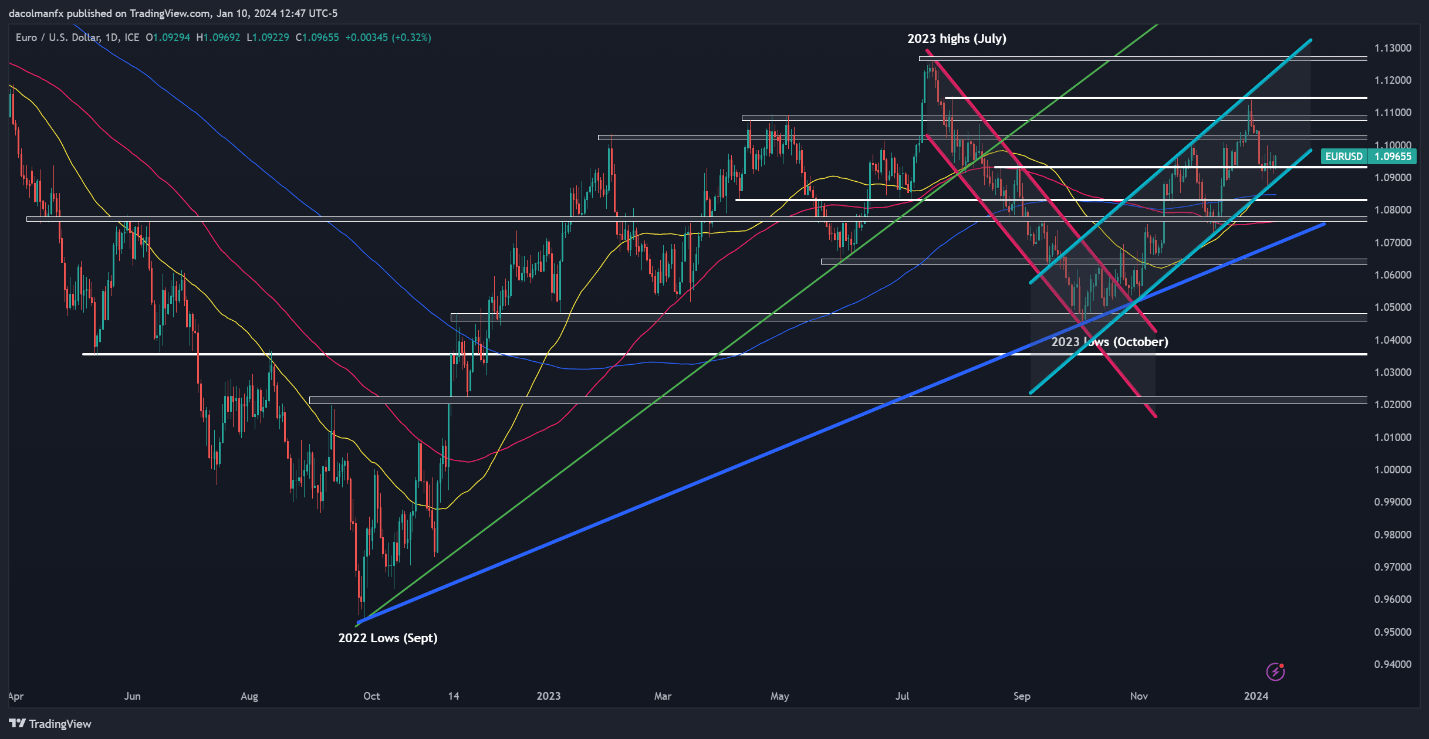
EUR/USD Chart Prepared Using TradingView
For a complete overview of the British pound’s prospects, request your complimentary Q1 trading forecast now!

GBP/USD TECHNICAL ANALYSIS
GBP/USD ticked up on Wednesday, approaching overhead resistance at 1.2765. Whether the bulls can propel prices above this barrier remains uncertain. However, a successful breakthrough might lead to a rally toward December's highs above the 1.2800 mark. Sustained strength hereon out may bring the spotlight to the 1.3000 handle.
Conversely, if GBP/USD reverses lower from its current position, a potential decline towards 1.2675 is a plausible scenario. It's crucial for this support region to remain intact; any breach could empower sellers to initiate a bearish assault on the psychological 1.26000 level. Subsequent losses could attract attention to the 200-day simple moving average.
GBP/USD TECHNICAL CHART
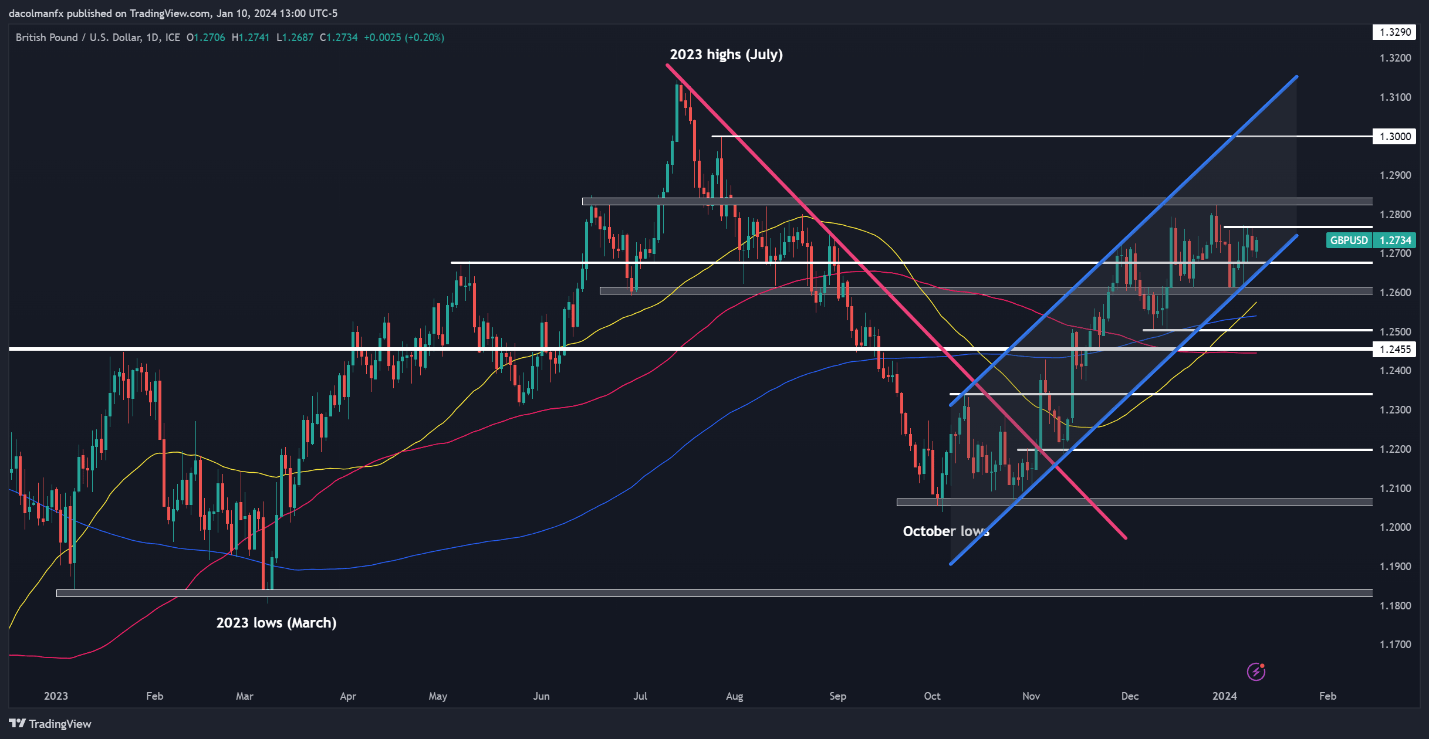
GBP/USD Chart Prepared Using TradingView
If you're looking for an in-depth analysis of U.S. equity indices, our first-quarter stock market trading forecast is packed with great fundamental and technical insights. Get it now!

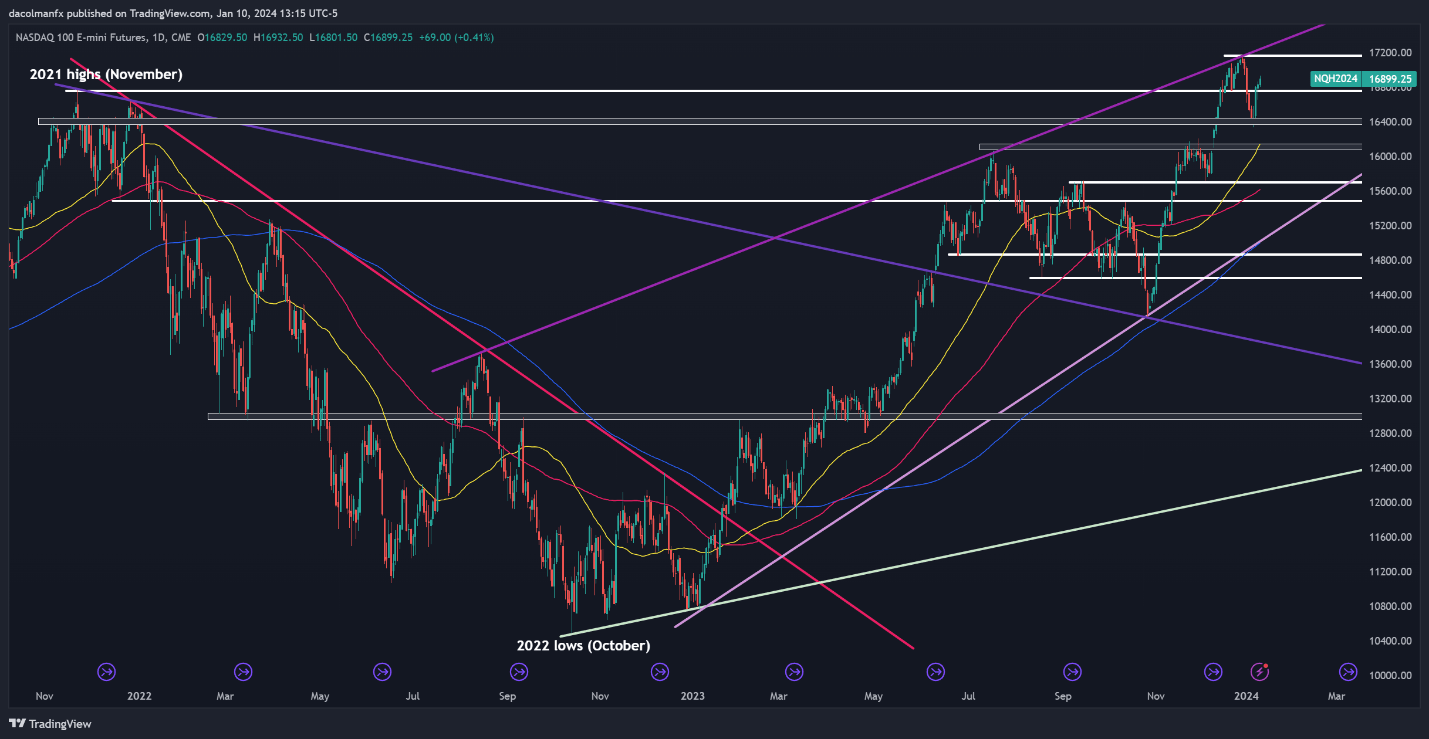
NASDAQ 100 TECHNICAL ANALYSIS
The Nasdaq 100 has regained momentum following a notable decline from late December into early January, reclaiming significant levels along the way, a sign that the technical outlook remains bullish. If the rebound extends in the near term, the first ceiling to monitor appears at the all-time high near 17,150. On further strength, a push toward trendline resistance at 17,300 is likely.
In the event of a bearish reversal, support can be spotted at 16,750. This floor must hold at all costs; failure to do so could send the tech index back towards 16,400. While prices may bottom out around this area on a pullback, a breakdown could exacerbate downward pressure, setting the stage for a drop towards 16,150 – the 50-day simple moving average.
NASDAQ 100 TECHNICAL CHART