
Interested in learning how retail positioning can give clues about the short-term trajectory of USD/CAD? Our sentiment guide has all the answers you are looking for. Get a free copy now!
| Change in | Longs | Shorts | OI |
| Daily | -12% | -11% | -11% |
| Weekly | 13% | -10% | 0% |
USD/CAD ANALYSIS
USD/CAD (U.S. dollar - Canadian dollar) retained a negative bias on Wednesday after the Bank of Canada voted to keep interest rates unchanged at 5.0%. While the decision to maintain the status quo was largely anticipated, the BoC left the door open for additional hikes despite abandoning its hawkish inflation characterization and acknowledging that the economy is no longer in excess demand.
From a technical standpoint, USD/CAD climbed earlier in the week, but turned lower after failing to take out trendline resistance near 1.3600, with prices subsequently slipping below the 100-day moving average. If losses accelerate in the coming days, support stretches from 1.3515 to 1.3485, where the 200-day SMA aligns with the December swing lows. On further weakness, the focus shifts to 1.3385.
In the event of a bullish reversal off current levels, the first hurdle to overcome is positioned near 1.3600. Successfully piloting above this technical barrier could propel the pair towards 1.3630. On continued upward impetus, bulls are likely to initiate an assault on the 50-day simple moving average hovering just below the 1.3700 handle.
USD/CAD TECHNICAL CHART
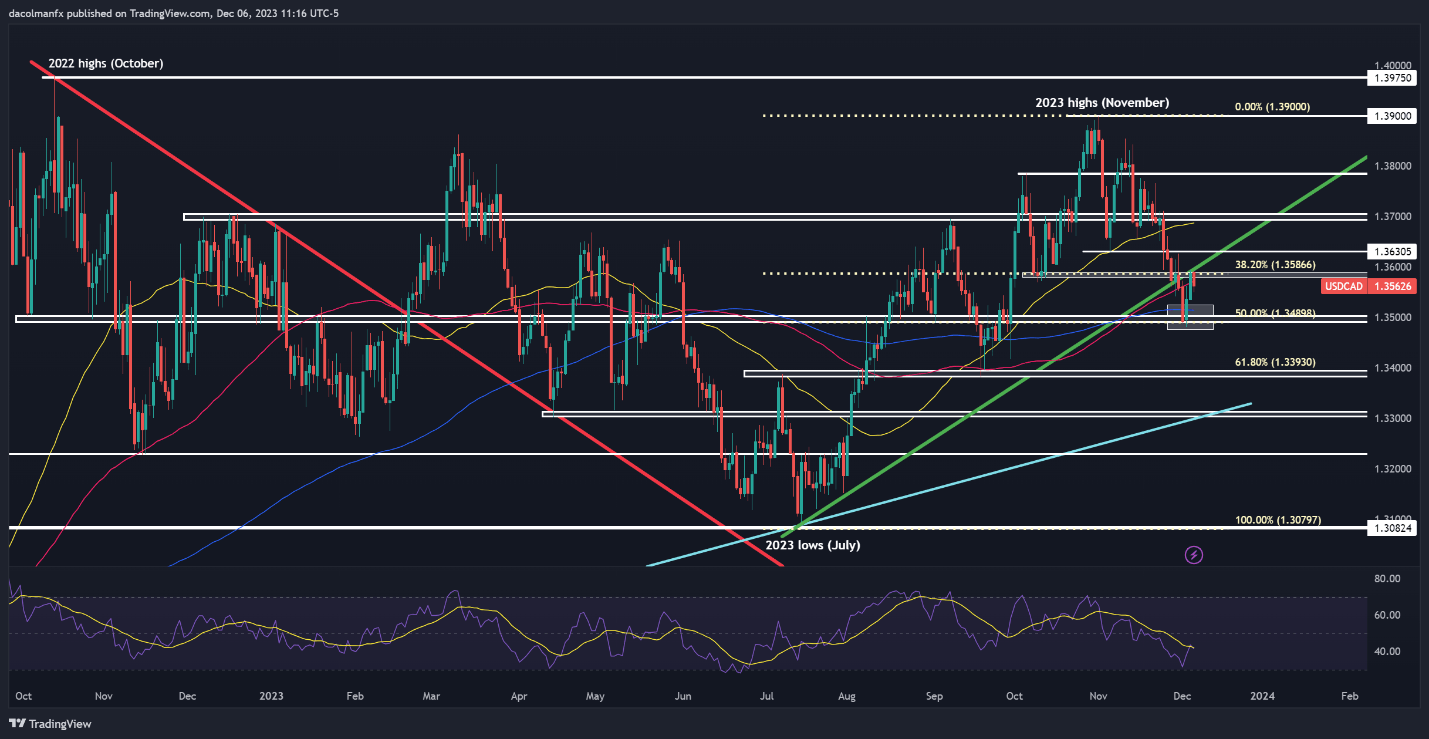
USD/CAD Chart Created Using TradingView
For the latest views on where the Japanese yen may be headed, download the quarterly fundamental and technical forecast. The trading guide is free!

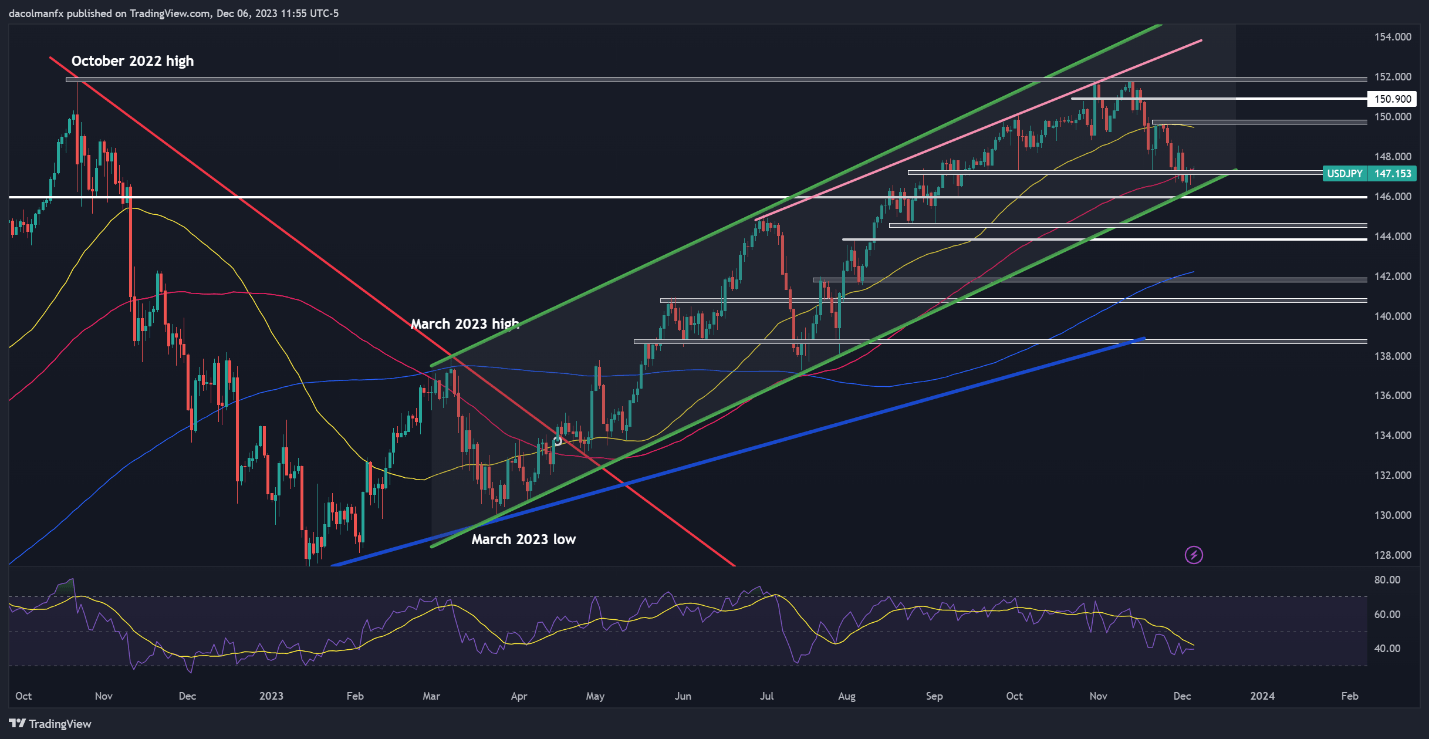
USD/JPY ANALYSIS
USD/JPY (U.S. dollar - Japanese yen) plummeted beneath its 100-day moving average last Friday, but bearish pressure lost traction this week when prices couldn’t breach the lower boundary of an ascending channel that has been active since March. A modest rebound ensued, allowing the pair the reclaim the 147.00 mark.
If gains pick up pace over the coming days, the first resistance to watch emerges around the 147.15/147.30 range. Upside clearance of this ceiling could pave the way for a rally towards 149.70. Sellers are likely to defend this area tooth and nail, but in case of a breakout, we can’t rule out a move towards 150.90. Conversely, if the bears stage a comeback and spark a pullback, the first floor to observe extends from 146.30 to 146.00. On further weakness, the attention will transition to 144.50, followed by 144.00.
USD/JPY TECHNICAL CHART