
U.S. DOLLAR ANALYSIS & TALKING POINTS
- Souring risk sentiment drives dollar rally.
- US jobless claims and ISM services PMI under the spotlight today.
- Trendline resistance under threat by DXY bulls.

USD FUNDAMENTAL BACKDROP
The Dollar Index (DXY) has maintained its elevated levels today after the Fitch ratings agency downgrade as the safe-haven aspect of the greenback comes into play - investors have been moving out of riskier asset classes including equities and seeking low risk options that include the USD from an FX point of view. Yesterday’s ADP employment change beat added to the bullish bias short-term as markets prepare for the upcoming Non-Farm Payroll (NFP) report on Friday.
Today’s focus (see economic calendar below) will be on initial jobless claims and US ISM services PMI’s, both of which are expected to show a moderation in the US economy. Unless actual figures on jobless claims exceed estimates and services significantly miss, the USD is likely to remain buoyant at current levels. As mentioned above, the NFP report will dominate the weeks economic data considering ADP numbers have not been a reliable gauge for the NFP print of recent, markets are adopting a cautious approach until NFP’s are released.
Foundational Trading Knowledge
Macro Fundamentals
Recommended by Warren Venketas
US ECONOMIC CALENDAR (GMT +02:00)
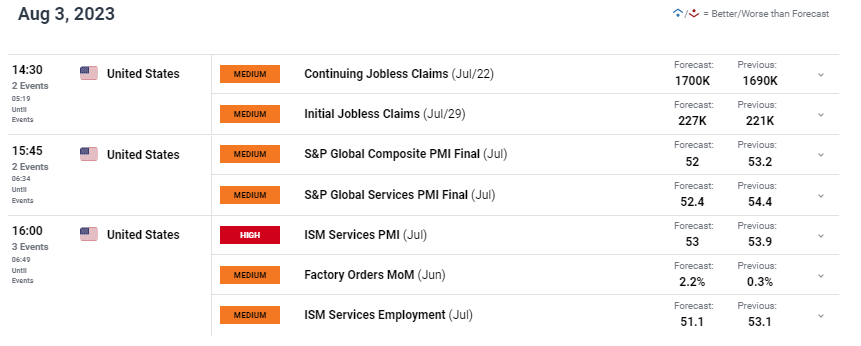
Source: Refinitiv
TECHNICAL ANALYSIS
Trade Smarter - Sign up for the DailyFX Newsletter
Receive timely and compelling market commentary from the DailyFX team
U.S. DOLLAR INDEX DAILY CHART
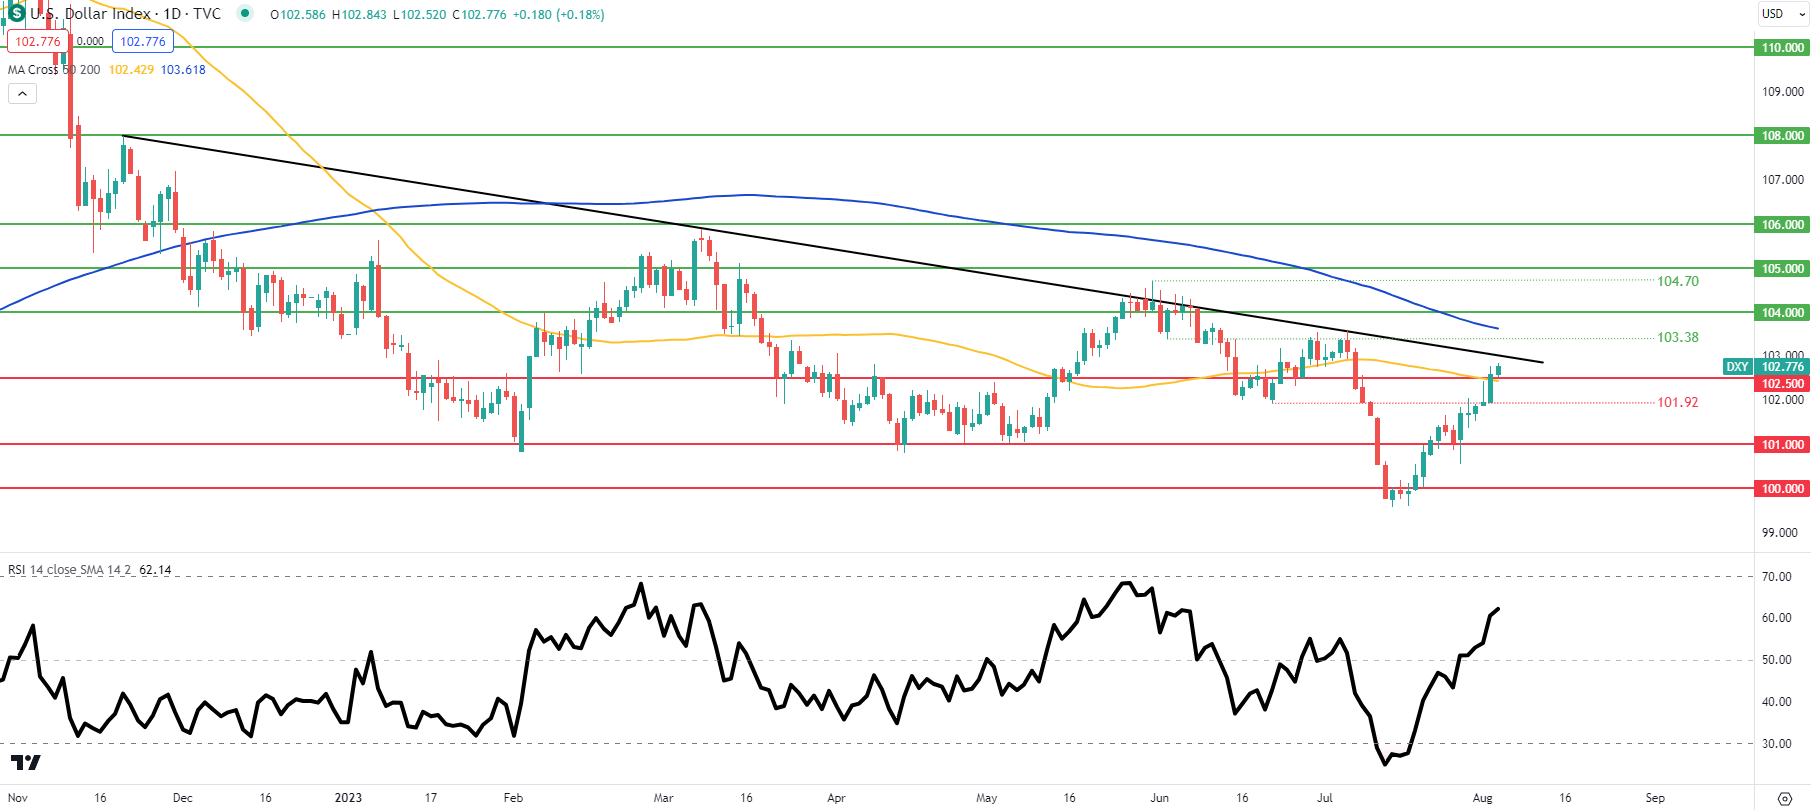
Chart prepared by Warren Venketas, IG
Daily DXY price action has pushed above the 102.50 psychological handle coinciding with the 50-day moving average (yellow). Bulls will now eye the medium-term trendline resistance (black) that has not been breached since early November 2022. A move towards this resistance zone could see the Relative Strength Index (RSI) move into overbought territory; suggestive of upside fatigue.
Resistance levels:
- 104.00
- 200-day moving average
- 103.38
- Trendline resistance
Support levels:
- 102.50/50-day moving average
- 101.92
- 101.00
Contact and followWarrenon Twitter:@WVenketas