


OIL PRICE, CHARTS AND ANALYSIS:
- WTI prices edge up once again.
- Production cuts from major exporters and fund interest are both helping the price.
- Inventory data are in focus this week.

Crude oil prices edged back up in Europe on Tuesday and remain well supported after a steady run of gains since late June.
A weaker United States Dollar does oil no harm among investors keen to buy dollar-denominated crude in other currencies, while extended production cuts from export giants Saudi Arabia and Russia are also supporting the market.
Another bright spot can be seen in reports that hedge funds and money managers reportedly went long of both the US benchmark West Texas Intermediate crude and the global Brent bellwether in the first week of this month, to the tune of 47 million barrels. This marks a turnaround from the heavy gloom which overshadowed the market into the end of June.
Of course, crude will never be truly poised to thrive while major central banks are raising interest rates in the hope of slowing economic activity and, thereby, inflation. Obviously, that’s not an environment likely to see runaway energy demand.
But, while more global rate hikes are surely coming, likely this month, energy markets seem convinced that the vast bulk of this action is now behind them and that they can look forward before long to steady rates, if not actual reductions.
The backdrop is likely to remain one of overall caution, however, given ongoing conflict in Ukraine and clear signs that China’s post-covid recovery is in trouble. Just this week the country was found to be on the edge of consumer-price deflation and calls for more economic stimulus from Beijing are sure to get louder. The World Bank recently forecast growth of just 2.1% this year for China, down from 2022’s 3.1%.
Moreover, the market looks well supplied, even given those production cuts. US shale production was reportedly up 9%in the year through April compared with the same period in 2022.
So, while prices may well struggle for sustainable, medium-term gains, focus this week will be on in inventory data, with the American Petroleum Institute’s numbers due Tuesday, and those from the Energy Information Agency coming up a day later.

US Crude Oil Technical Analysis
US Crude WTI Daily Chart
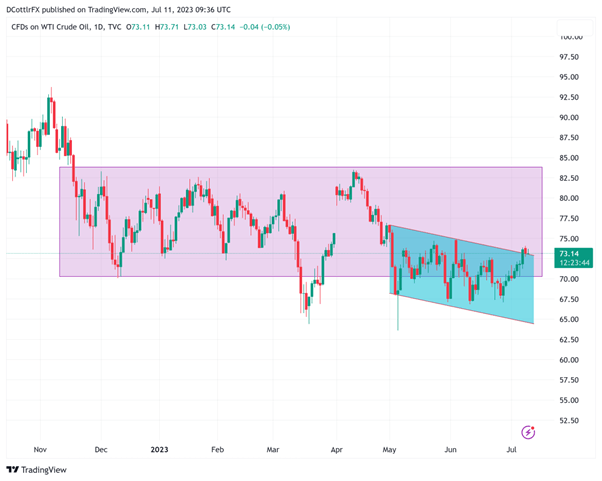
Chart Compiled Using TradingView
Prices have once again proved reluctant to remain for long below a broad trading band whose lower bound extends from December 9’s intraday low of $70.12. This band seems to get traded back above whenever that level is relinquished, as has happened no fewer than five times since mid-March. Now, this may be due to no more than characteristically subdued trading thanks to the northern-hemisphere summer, but the level bears watching nonetheless.
Bulls are now eyeing resistance from May 23 at$74.49, which they’re going to have to take and hold before trying the recent peak, June 5’s $74.89. Clearly the $75 mark forms some sort of psychological resistance, however. The market has been uncomfortable above that since May, and will likely continue to be, with sellers likely to come out on any approach.
At some point either that level will be topped or the $70.12 support will conclusively give way, but the catalyst for either looks to be still out there. Still, the market looks at least short-term bullish.
IG’s own sentiment indicator finds 65% of participants still long at current levels.
---By David Cottle for DailyFX


