


Oil (WTI) News and Analysis
- Massive risk aversion hits oil markets in a busy, volatile week
- Oil whipsaws as intra-day pullback attempts to halt the drop, NFP up tomorrow
- The analysis in this article makes use of chart patterns and key support and resistance levels. For more information visit our comprehensive education library

Massive Risk Aversion Hits Oil Markets
This week was already shaping up to be a busy and volatile one considering all the ‘high importance’ scheduled event risk and that was before banking fears reemerged. In the early hours of Monday morning JP Morgan agreed to take on depositors from the beleaguered First Republic Bank but it wasn’t until Tuesday that the mood really shifted.
Regional banks like PacWest Bancorp and Western Alliance are seeing their respective share prices selloff aggressively today as the Nasdaq regional banking index gapped around 3.3% lower at the open. The return of the banking turmoil the same week the Fed hiked interest rates for possibly the last time, resulted in a massive risk off move in oil. The oil market is often viewed as an indication of future economic activity and the weight of the move was more than enough to overcome any support that OPEC’s recent supply cut ought to have provided.
Oil Technical Levels to Consider
The weekly chart puts the current move into perspective, printing a new yearly low before pulling back sharply. The pullback is unsurprising given the sheer size of the move over the last two to three days. In fact, it is only with the help of the weekly chart that further levels of support can be assessed. Below the 38.3% (65.25) Fibonacci retracement of the major 2020 to 2022 move, the 61.55 level becomes the next relevant zone.
WTI (CL1!) Weekly Chart
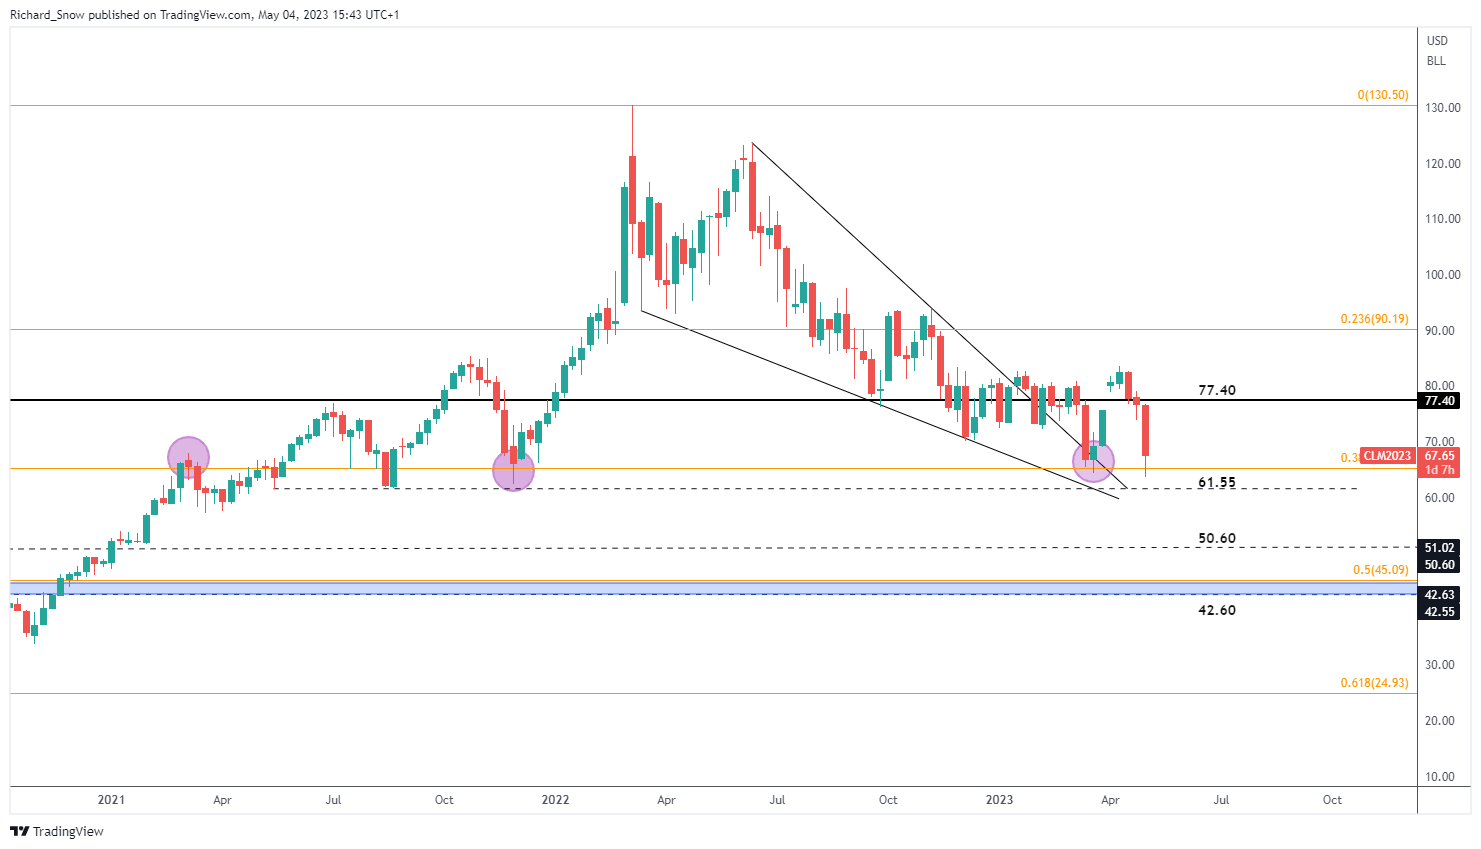
Source: TradingView, prepared by Richard Snow

The daily chart, shows the sizeable pullback of the recent selloff, however price action is yet to reveal a gain on the day at the time of writing. The RSI nears oversold territory but the pullback may delay such a reading for the time being. Prices actually rest narrowly above the Biden administrations desired level to replenish SPR reserves but has since admitted that such refills will take years. Therefore, the significance of this level is all but nullified and no longer acts as pseudo support. To the upside, the psychological level at 70 flat is the nearest level of resistance with support at 65.25, followed by the intra-day swing low of 63.64. The week of volatility is not done yet, tomorrow is NFP where more jobs are expected to have been added even if it’s the lowest addition since early 2021.
WTI (CL1!) Daily Chart
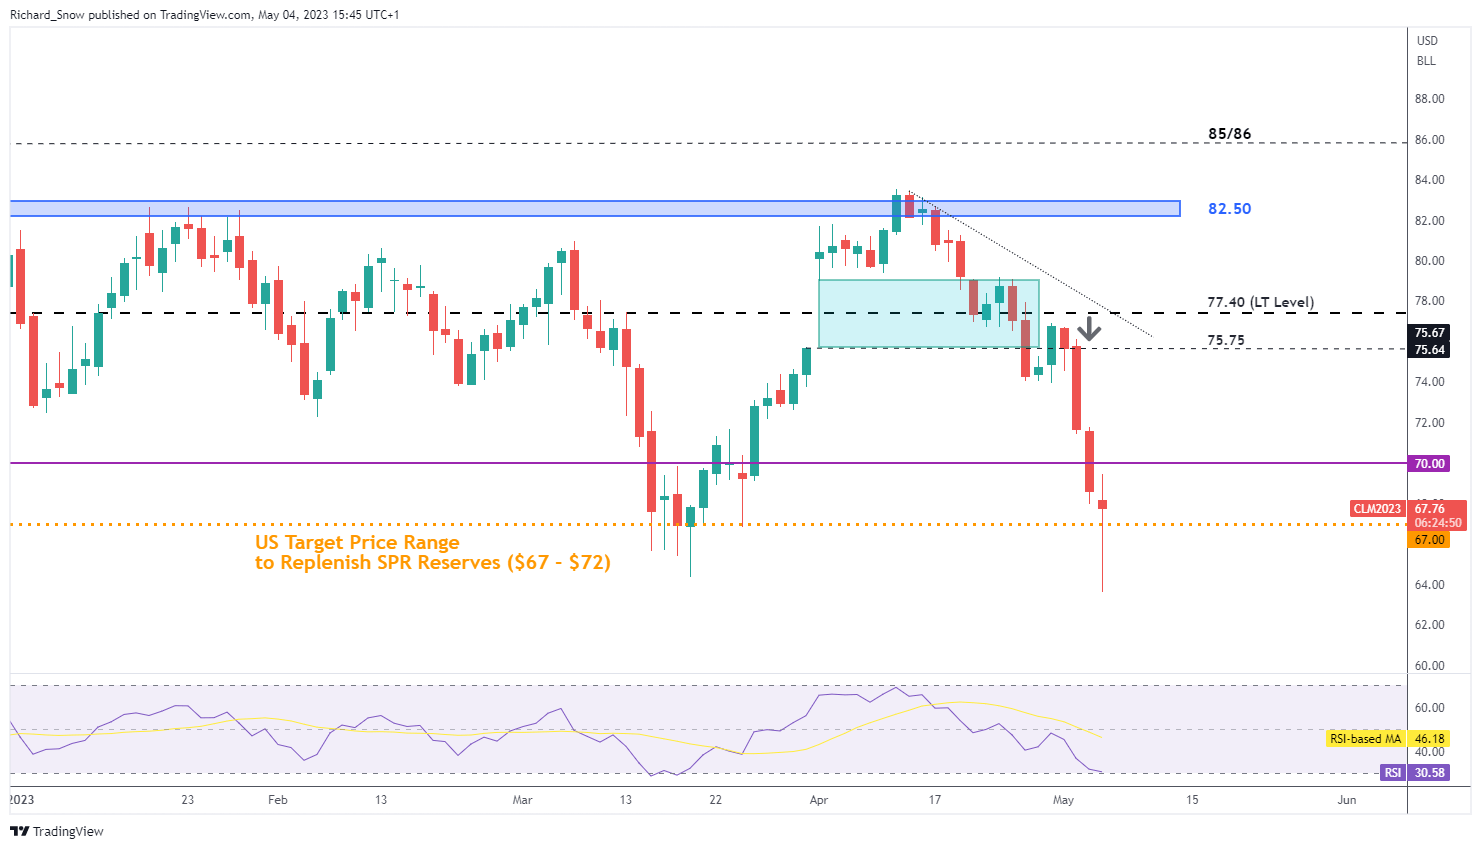
Source: TradingView, prepared by Richard Snow
--- Written by Richard Snow for DailyFX.com
Contact and follow Richard on Twitter: @RichardSnowFX


