

Crude Oil Weekly Technical Outlook - Bullish
- Crude oil prices on course for a 4th monthly gain
- Daily chart Bearish Harami may have follow-through
- While momentum is fading, trend remains bullish

Daily Chart
WTI crude oil prices rallied 1.4 percent this past week, bringing September’s rise to 4.4%. While the month is still fairly new, the commodity is now heading for a 4th consecutive monthly gain. If confirmed, this would be the longest winning streak since March 2022.
A closer look at the daily chart shows that oil prices left behind a Bearish Harami candlestick pattern by Thursday’s close. But, on Friday prices pushed higher, undermining the formation. Downside follow-through is still possible at this stage and such an outcome would offer an increasingly bearish technical outlook.
Otherwise, extending higher would place the focus on the 61.8% Fibonacci extension level at 88.76. In the event of a turn lower, that would place the focus on the 50-day Moving Average (MA).
| Change in | Longs | Shorts | OI |
| Daily | 0% | 3% | 0% |
| Weekly | -2% | 8% | 0% |
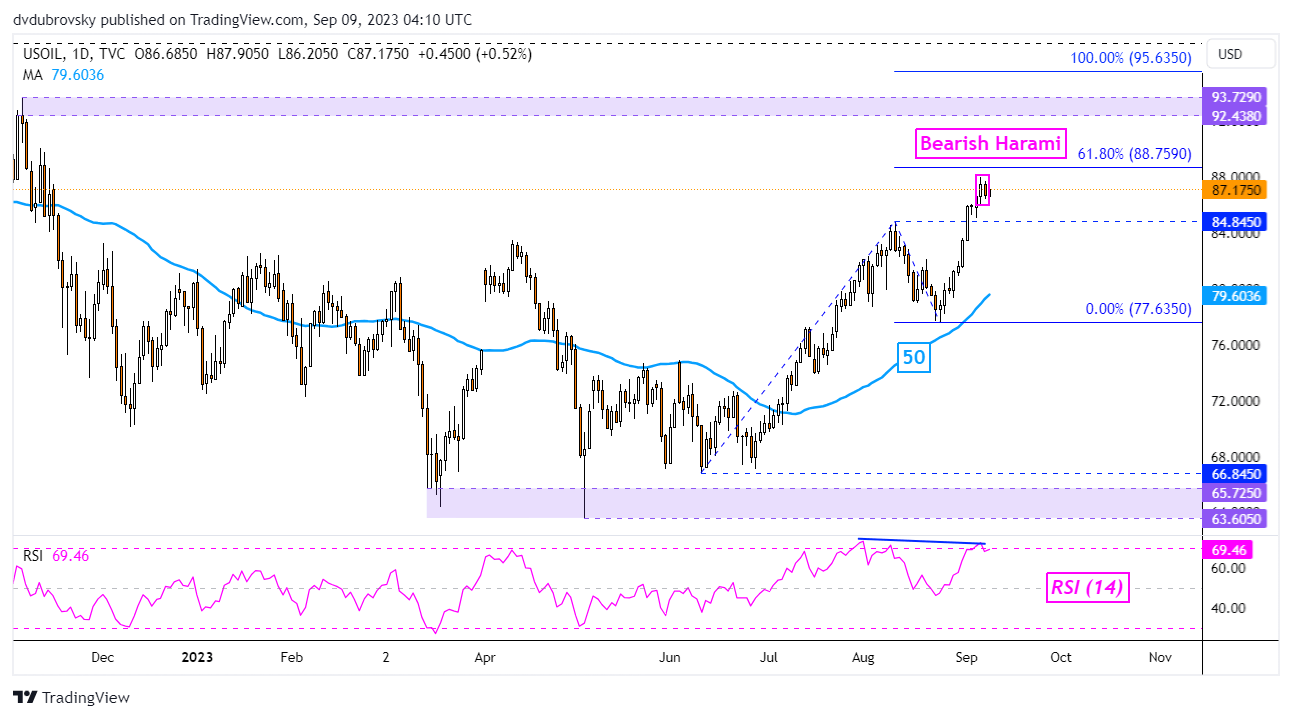
Chart Created in TradingView
4-Hour Chart
Zooming in on the 4-hour chart shows that accompanying the Bearish Harami is negative RSI divergence. This is a sign of fading upside momentum, which can at times precede a turn lower.
On this timeframe, key support below is also the 50-day MA. This line could hold, reinstating the broader upside technical bias. If not, a breakout to the downside exposes the early August inflection point of 84.85 before the 23.6% level at 81.77 kicks in.
Otherwise, immediate resistance heading into the new week is 88. On balance, while there are preliminary bearish warning signs, the broader trend still remains biased higher, leaving a bullish outlook.

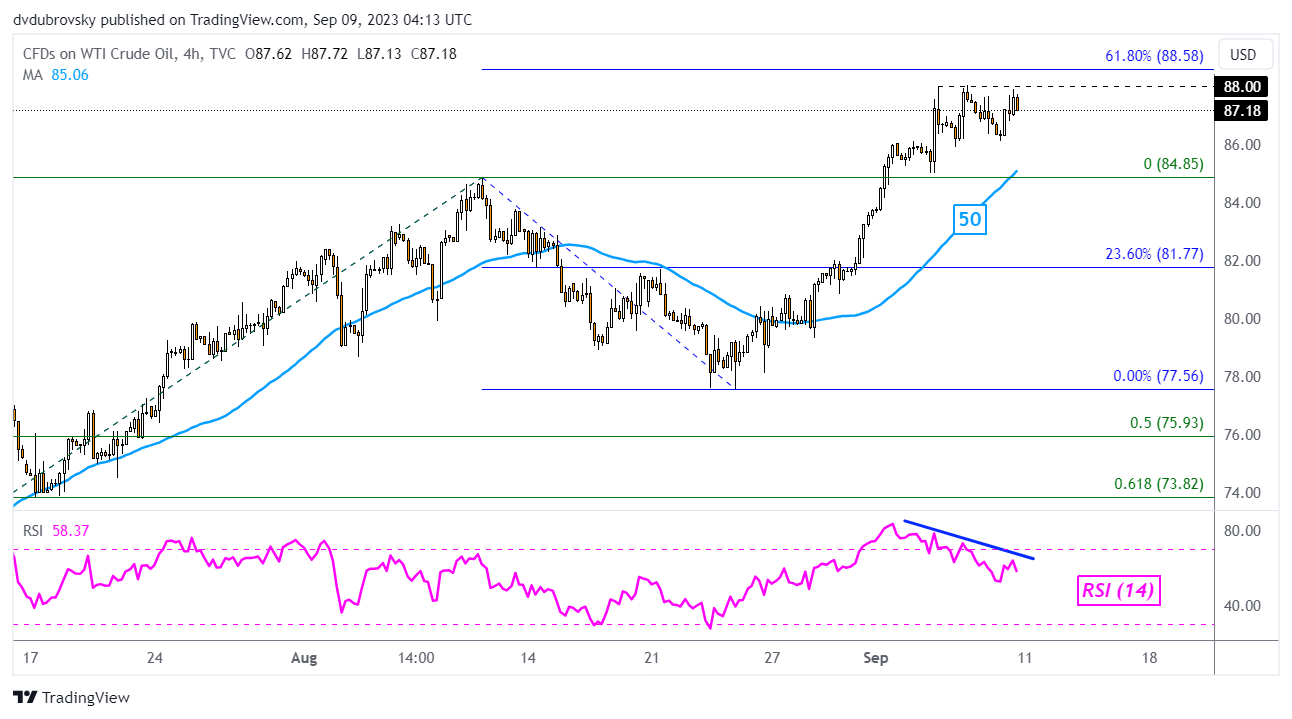
Chart Created in TradingView
--- Written by Daniel Dubrovsky, Strategist for DailyFX.com